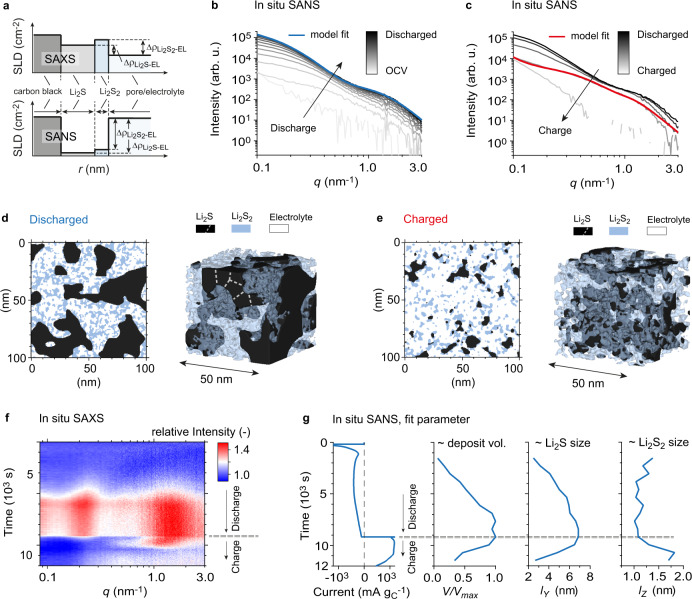
Fig. 4. A stochastic SANS model to describe the nanoscale phase evolution of Li2S / Li2S2 deposits.
a Sketch of scattering length densities of the different phases during a SAXS experiment (top) and a SANS experiment (bottom). The difference of scattering length densities (SLDs) is related to the materials contrast during a scattering experiment. SANS has higher materials contrast than SAXS and minimizes the carbon scattering contribution. Detailed numbers are given in Supplementary Table 1. b Background-corrected SANS intensities versus scattering vector length q during potentiostatic discharge at 2.0 V vs. Li/Li+. The plurigaussian random field (PGRF) model fit at the end of discharge is given in blue. c Background-corrected SANS intensities versus scattering vector length q during potentiostatic charge at 2.45 V vs. Li/Li+. The plurigaussian random field (PGRF) model fit after 38 min of charging is given in red. d–e The corresponding representative real space models generated via PGRFs and the input parameters obtained from the model fits in b and c. d–e show a 100 nm2 cross section, and a 3D visualization of a 50 nm3 cut-out. White dashed lines indicate schematically that Li2S aggregates consist of individual Li2S grains. f Experimental relative SAXS intensity change as a function of time and scattering vector q during potentiostatic discharge/charge. The data is the same as in Fig. 2d and shown for direct comparison with SANS fits. g Current signal and fit parameters as a function of time, obtained from PGRF model fits of the operando SANS data in b and c. The parameter V/Vmax corresponds to the relative amount of Li2S/Li2S2 deposit during the experiment. lY and lZ correspond to a correlation length of the Li2S and Li2S2 deposits, respectively. These length values are proportional to the actual particle sizes, which can be seen in d and e. Based on the q-position the particle/aggregate diameters were estimated to be around 26 nm and 2.8 nm at the end of discharge (see Supplementary Fig. 6). The Li2S aggregate size clearly increases during discharge, the Li2S2 particle size slightly decreases during discharge, before it increases at the beginning of charge. The shift of the high-q SAXS intensity maximum during charge (f) shows the same behavior with better time resolution.

