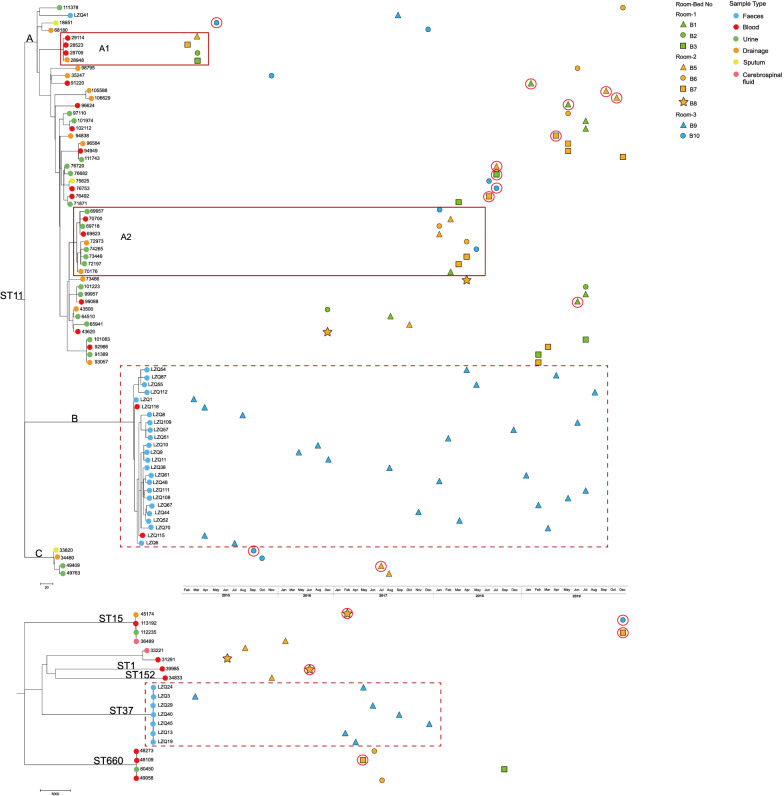
Fig. 3.
Isolation time and phylogenetic analysis of 95 CRKP isolates in the ICU. The upper figure shows the phylogenetic analysis of 76 ST11-CRKP isolates, and the lower figure shows the phylogenetic analysis of 19 other ST-type CRKP isolates. The dots on the clade indicate the sample origin of the isolate. Solid red rectangles represent clonal outbreaks in clade A, and dashed red rectangles represent CRKPs (ST11 and ST37) isolated from the Patient (Room-3-B9). Wards and beds are represented by a combination of colors and shapes. Isolates with HAIs occurring before ICU admission are indicated by red circles

