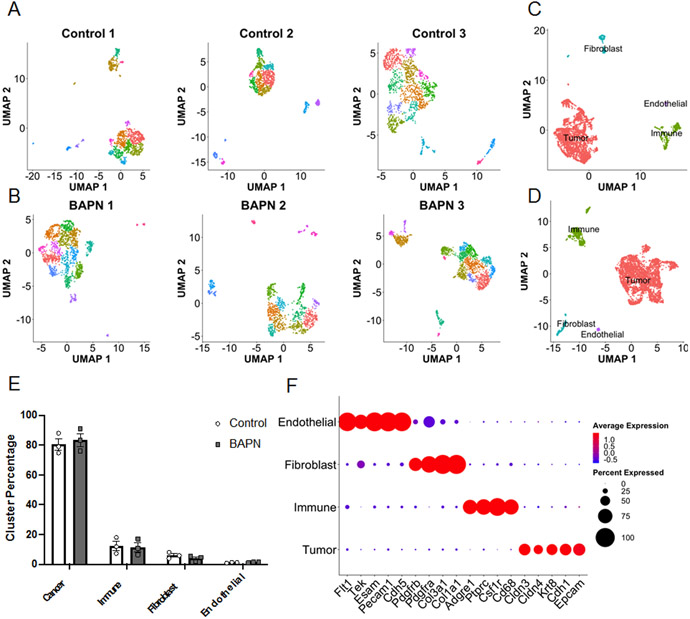
Figure 2.
Single cell RNA-seq reveals similar transcriptional landscapes between stiff and compliant MMTV-PyMT tumors. Individual UMAP projections of each individual sample from A. stiff and B. compliant tumors and clustered via Seurat. C. Stiff and D. compliant tumors integrated onto a single UMAP projection and clusters labeled by cell type determined by expression of canonical markers below. E. Distribution of libraries across the 4 main cell types. Data plotted as mean +/− SEM. N=3. F. Gene expression of the canonical cell type markers.

