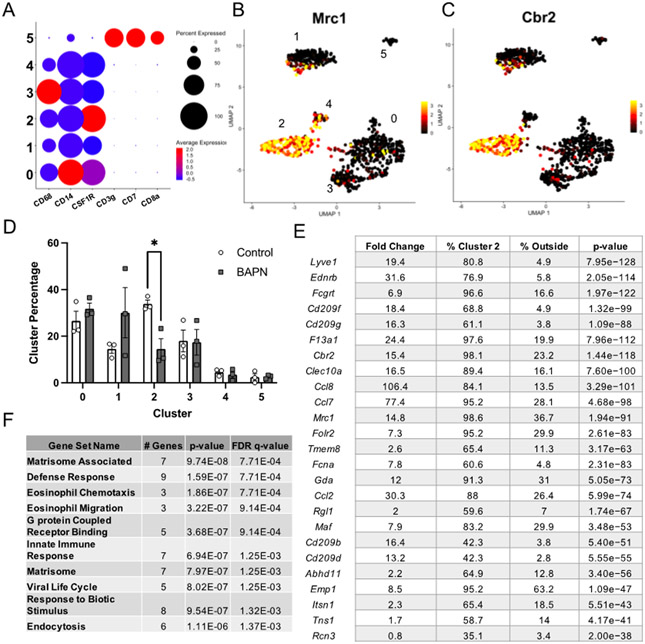
Figure 3.
Immune cell annotation reveals immune cells are predominantly composed of macrophages and enrichment of M2-like macrophages in stiffer tumors. A. Expression of canonical macrophage and T-cell markers across cells in the immune category. B,C. Expression of canonical M2-like macrophage markers overlaid on UMAP projections of the cells in the immune group. D. Comparison of the distribution of immune cells to each subpopulation plotted as mean +/− SEM. N =3. E. Top 25 conserved marker genes for immune cell cluster 2. Table displays the average fold expression within cluster 2 compared to the rest of the cells, the percentage of cells expressing each transcript in cluster 2 versus the remaining clusters, and the adjusted p-value for the transcript. F. GO Term enrichment of the top 25 marker genes for the M2-like macrophage subpopulation. *p<0.05

