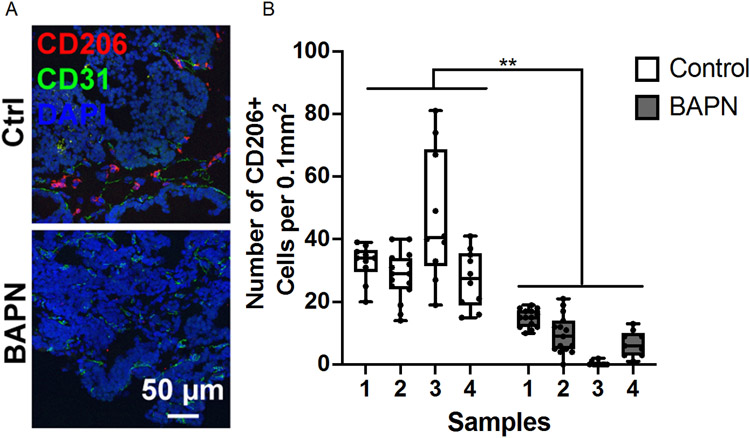
Figure 5.
Quantifying macrophage polarization in the MMTV-PyMT breast tumor microenvironment. A. Representative images of MMTV-PyMT tumor sections stained for DAPI (blue), CD31 (green), and CD206 (red). B. Quantification of stained tumor sections. Number of CD206+ cells per field of interest. N=4 (number of mice), n = 9-15 (number of data points). **p<0.01

