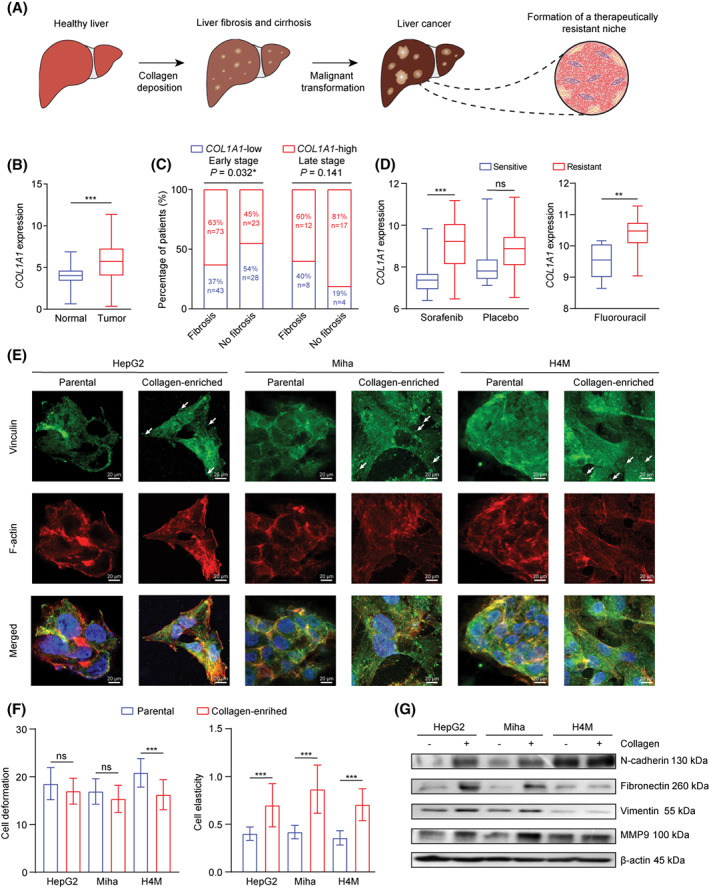
FIGURE 1.

Collagen accumulation in the liver cancer microenvironment and its association with chemoresistance and EMT. (A) Graphical abstract of a three‐stage malignant transformation from a healthy liver to liver cancer. (B) COL1A1 expression in normal individuals (n = 50) and patients with liver cancer (n = 369) from TCGA. (C) Correlation between COL1A1 expression and liver fibrosis in early tumor stage (stage I and II) and late tumor stage (stage III and IV). (D) COL1A1 expression in patients treated with sorafenib (sensitive n = 21, resistant n = 46), placebo (sensitive n = 21, resistant n = 51), and 5FU (sensitive n = 8, resistant n = 15) from GSE109211 and GSE28702. (E) Immunofluorescence staining showed vinculin (green) and F‐actin (red) expression in parental and collagen‐residing HepG2, Miha, and H4M cells. White arrows indicate focal adhesion sites on cells. Scale bar, 20 μm. (F) Cell stiffness qualification was evaluated in parental and collagen‐residing cells based on cell deformation and elasticity in a microfluidic chamber. (G) Western blot result of epithelial and mesenchymal markers expressed in parental and collagen‐residing cells. (B,D,F) *p < 0.05, **p < 0.01, ***p < 0.001. 5FU, 5‐fluorouracil; COL1A1, collagen type I, alpha 1; EMT, epithelial–mesenchymal transition; GSE, gene expression data series; MMP9, matrix metalloproteinase 9; ns, not significant; TCGA, The Cancer Genome Atlas
