Figure 5.
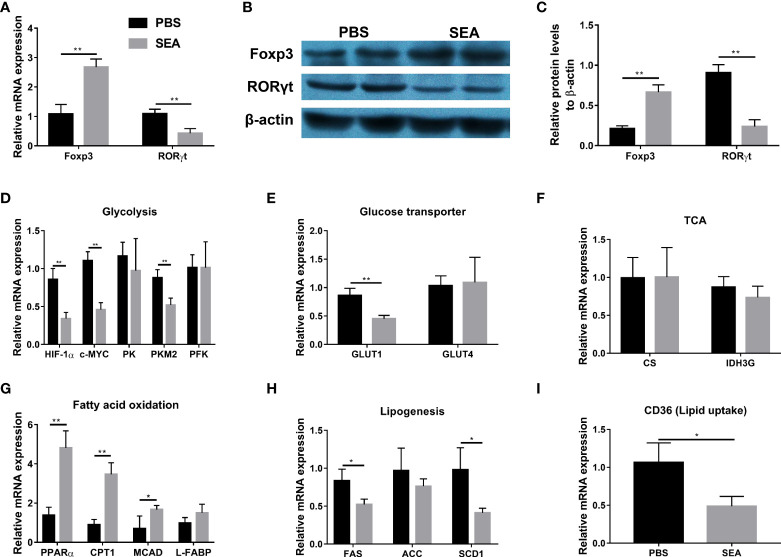
Modification of Treg and Th17 expansion by SEA via regulating glucose and lipid metabolism in vitro. Spleen naïve CD4+ T cells (CD4+ CD25- CD44- CD62L+) were sorted from the TNBS mice on the 5th day post TNBS administration. T cells were cultured (3×10⁵ cells/well) in 96-well plates coated with anti-CD3 mAb (5 μg/mL) and soluble anti-CD28 mAb (3 μg/mL) and kept in presence of IL-2 (100 U/mL). SEA (10 µg/mL) was added and PBS used as the control. Cells were cultured in RPMI-1640 Medium, 10% fetal calf serum, 2 mM L-glutamine, and 100 U/mL of Penicillin/Streptomycin for 3 days. The relative mRNA expression levels of Foxp3 and RORγt (A). The protein expressions of Foxp3 and RORγt (B, C). The relative mRNA expression levels of genes associated with glycolysis (D), glucose transporter (E), TCA (F), fatty acid oxidation (G), lipogenesis (H) and lipid uptake (I) were detected. Data are expressed as means ± SEMs based on 3 samples in each group and from 3 independent experiments. Asterisks mark significant differences among different groups (*P< 0.01, **P < 0.01).

