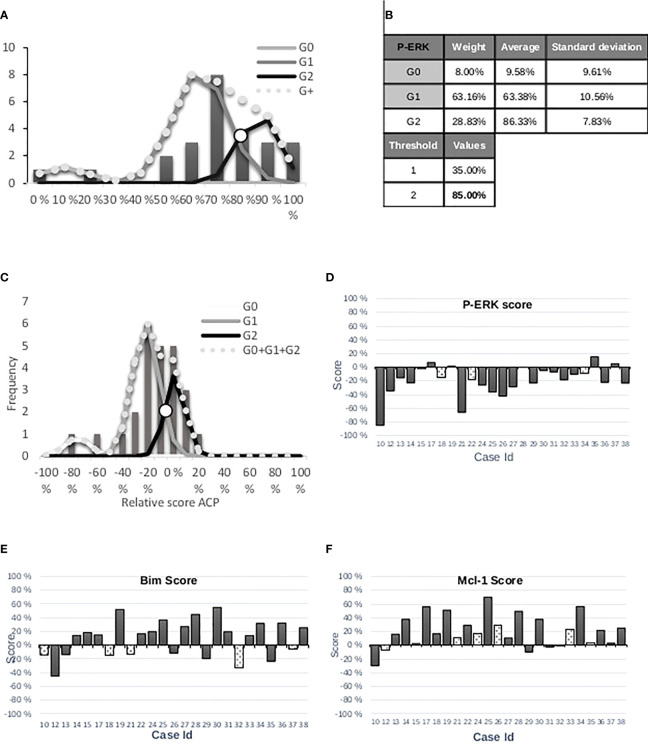
Figure 6.
(A) Distribution of values of principal component 1 for P-ERK and three Gaussian functions. Automatic thresholds are determined with the algorithm of the Gaussian Mixture Model. (B) The threshold values correspond to crossing between Gaussians. (C) The highest threshold was selected and used as the 0-value. (D) Histogram representation of P-ERK marker score per patient by rapid reading. White bars corresponding to discordance between experts and IP. (E) Histogram representation of Bim marker score per patient. (F) Histogram representation of P-Mcl-1 marker score per patient.

