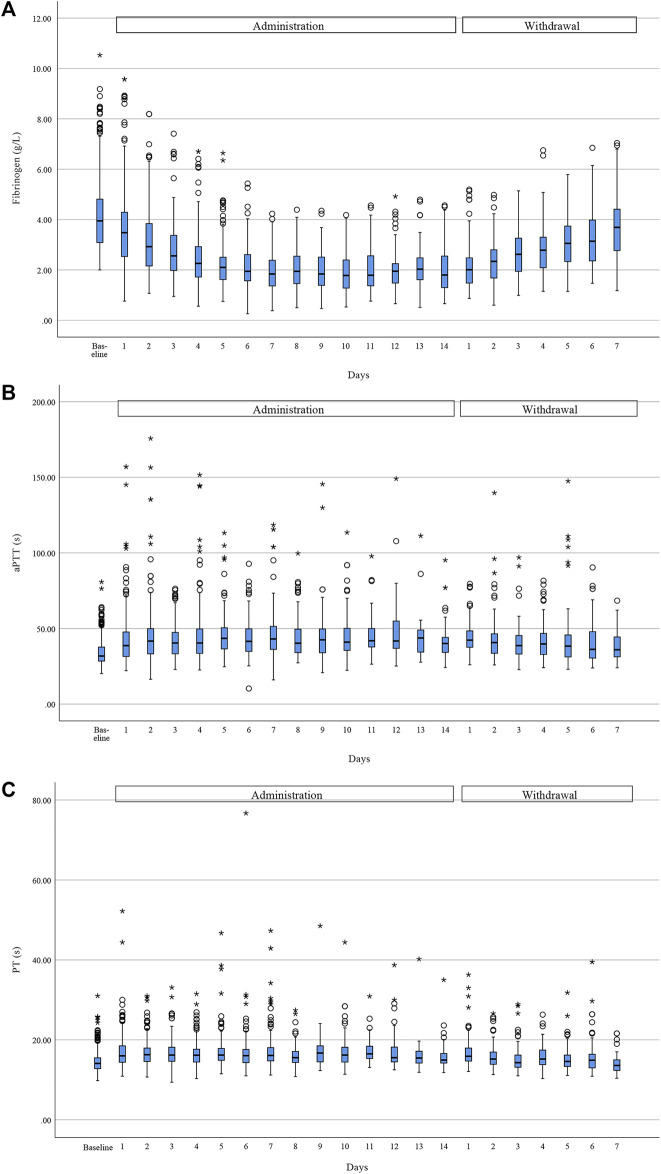
FIGURE 2.
Trend of coagulation function during tigecycline administration and after withdrawal. Fibrinogen (A) showed a downward trend during administration and a rebound after withdrawal, while aPTT (B) and PT (C) rose during treatment and fell after withdrawal. Horizontal bars represent the median value, boxes represent the interquartile range, whiskers represent the 5th and 95th percentiles and hollow circle and asterisk indicate the outlier. (Due to the different course of administration and the relatively few data at the late stage of administration and withdrawal, we only showed trend of coagulation for the first 14 days of administration period and the first 7 days after withdrawal).

