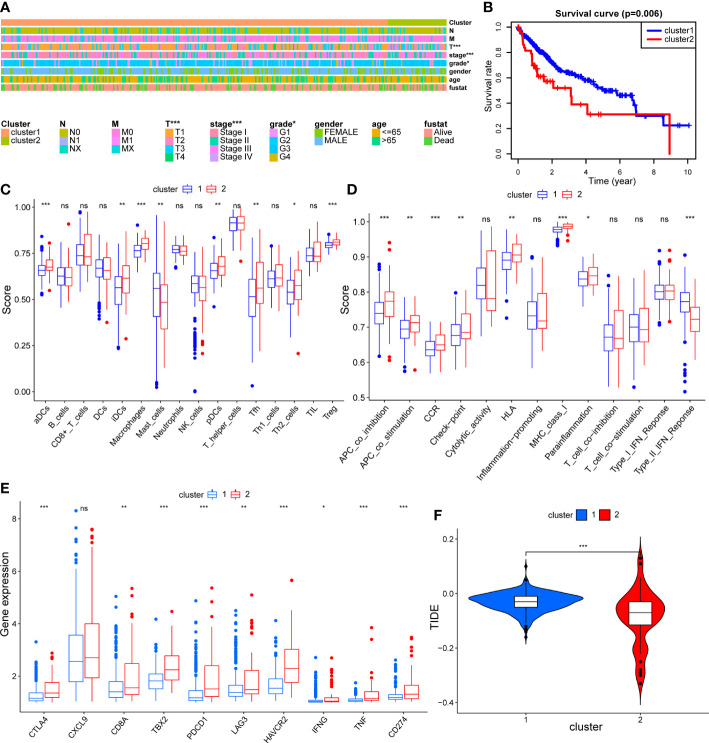
Figure 10.
The validation of mitophagy-related HCC subtypes using mitophagy signature obtained from cell experiment. (A) A heatmap showing association between subtypes and clinical characteristics. (B) The Kaplan–Meier plot showing distinct prognosis between two subtypes. (C–E) Box plots showing the differences of infiltrating immunocyte abundance (C), immune reaction activity (D), and expression of immune-checkpoint genes (E) between two subtypes. (F) Violin plots comparing the Tumor Immune dysfunction and Exclusion (TIDE) score of each subtype. The asterisks represent the p value (*p < 0.05; **p < 0.01; ***p < 0.001). ns, not significant.

