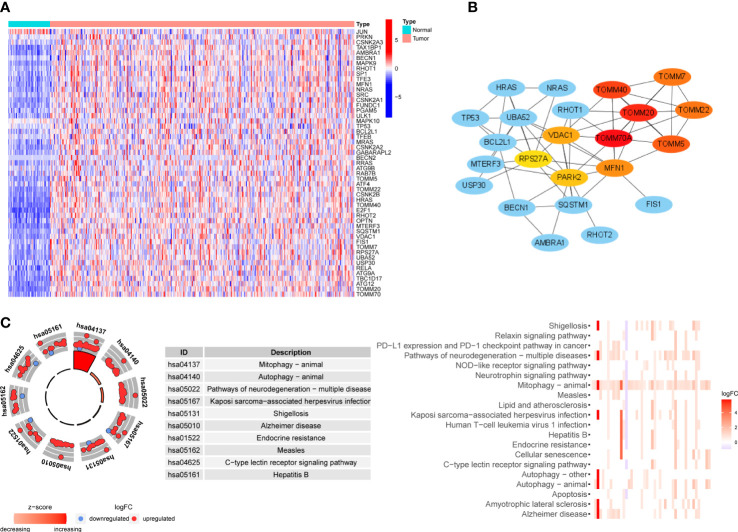
Figure 2.
Expression level, interactions and functional enrichment analysis of DEMs between tumor samples and normal samples. (A) Profile of DEMs based on sample type. Color represents expression level (blue to red). (B) Hub protein-protein interaction network among DEMs. Color represents confidence (blue to red). (C) KEGG analysis of DEMs. DEMs: Differentially expressed mitophagy-related genes, KEGG: Kyoto Encyclopedia of Gene and Genome.

