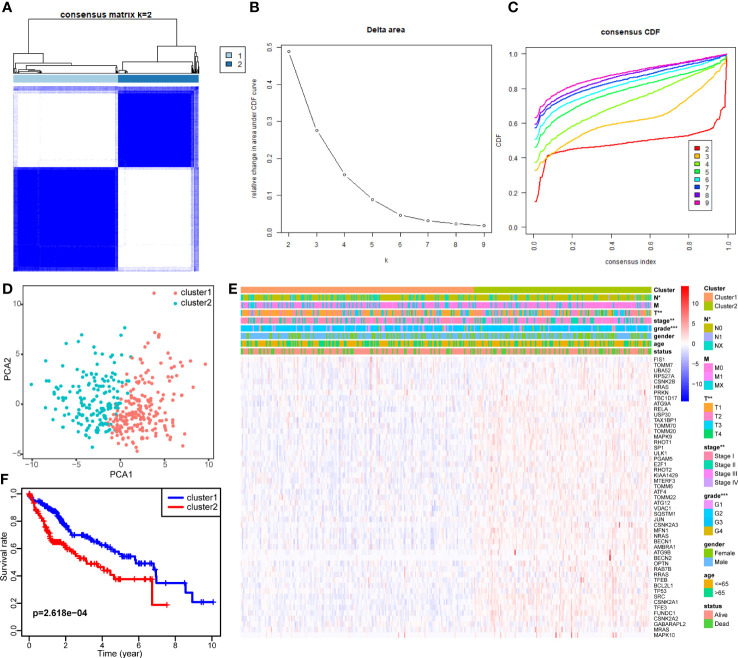
Figure 3.
Identification of two mitophagy-related HCC subtypes with different prognosis. (A–C) Consensus matrix of HCC samples co-occurrence proportion for k = 2 (A), relative change in area under the CDF curve for k from 2 to 7 (B), consensus clustering CDF for k from 2 to 7 (C). (D) Principal component analysis of HCC samples grouped by subtype. (E) A heatmap showing the association of mitophagy-related subtypes with clinical characteristics and expression of DEMs. (F) The Kaplan–Meier plot showing the overall survival differences between the two subtypes. The asterisks represent the p value (*p < 0.05; **p < 0.01; ***p < 0.001). DEMs, Differentially expressed mitophagy-related genes. CDF, Cumulative distribution function.

