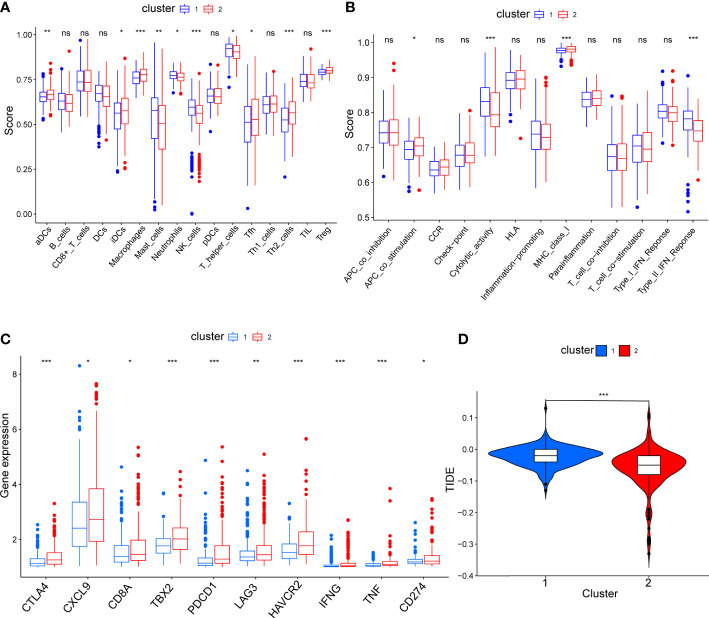
Figure 4.
The comparison of immune status between mitophagy-related subtypes. Box plots showing the differences of infiltrating immunocyte abundance (A), immune reaction activity (B), expression of immune-checkpoint genes (C) and violin plots showing Tumor Immune dysfunction and Exclusion (TIDE) score (D). The asterisks represent the p value (*p < 0.05; **p < 0.01; ***p < 0.001). ns, not significant.

