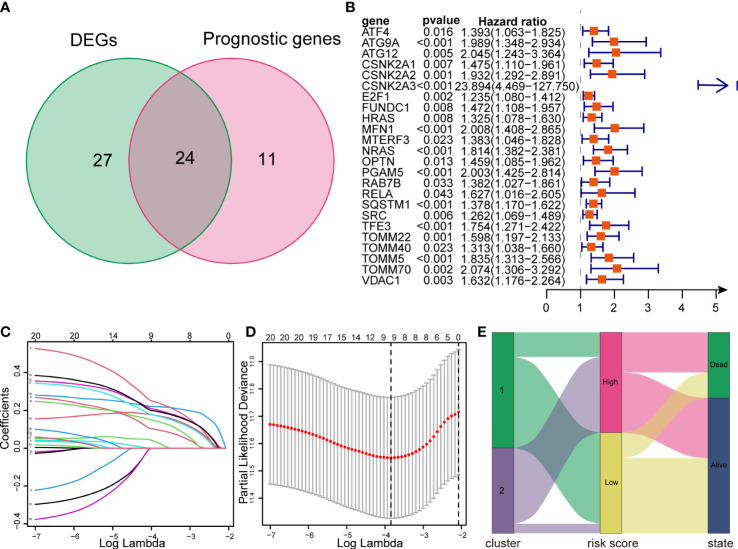
Figure 7.
Construction of a LASSO regression model and correlation between subtypes and risk groups. (A) Venn diagram showing intersection between DEMs and prognostic genes. (B) Forest plots showing the results of univariate Cox regression analysis of overlapped genes. (C, D) LASSO regression analysis of the overlapped genes. (E) The Sankey diagram showing the distribution of patients in mitophagy-related subtypes, risk groups and survival outcomes. LASSO, Least absolute shrinkage and selection operator.

