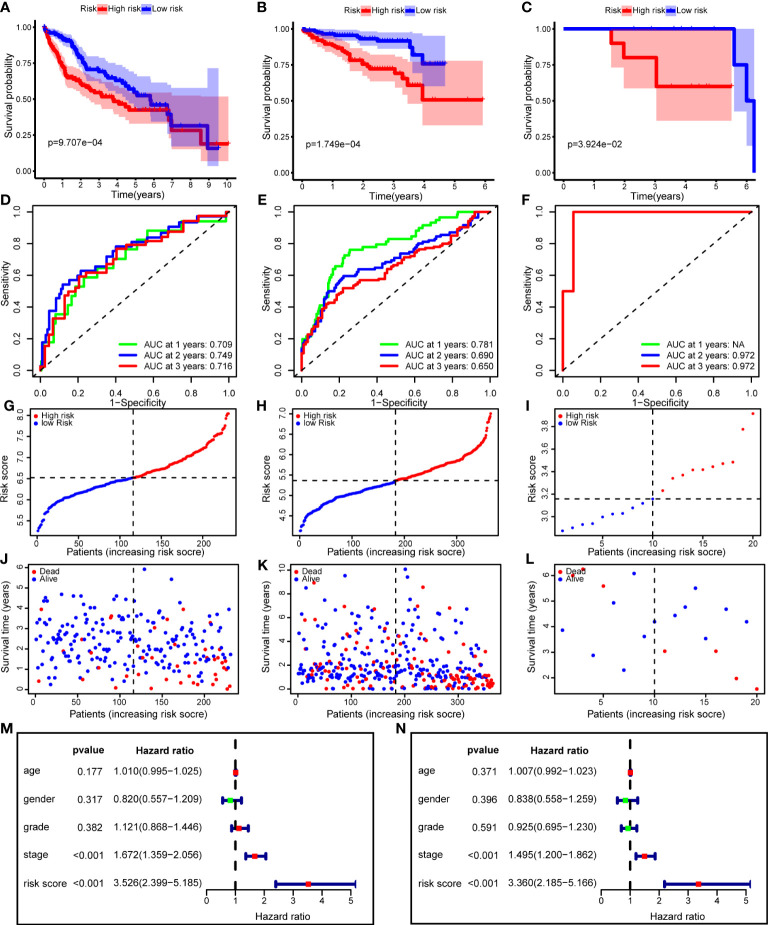
Figure 8.
The risk model performance in training cohort and two validation cohorts. (A–C) Kaplan-Meier curves for the OS of patients in the high- and low-risk group in the TCGA cohort (A), ICGC cohort (B) and PUMCH cohort (C). (D–F) AUC of time-dependent ROC curves in the TCGA cohort (D), ICGC cohort (E) and PUMCH cohort (F). (G–I) The distribution and median value of the risk scores in the TCGA cohort (G), ICGC cohort (H) and PUMCH cohort (I). (J–L) The distributions of risk scores, survival states and survival outcomes in the TCGA cohort (J), ICGC cohort (K) and PUMCH cohort (L). (M, N) Forest plots showing the univariate (M) and multivariate (N) Cox regression analyses regarding OS in the TCGA cohort. OS, Overall survival, AUC, area under the curve, ROC, receiver operating characteristic, TCGA, The Cancer Genome Atlas, ICGC, International Cancer Genome Consortium, PUMCH, Peking Union Medical College Hospital.

