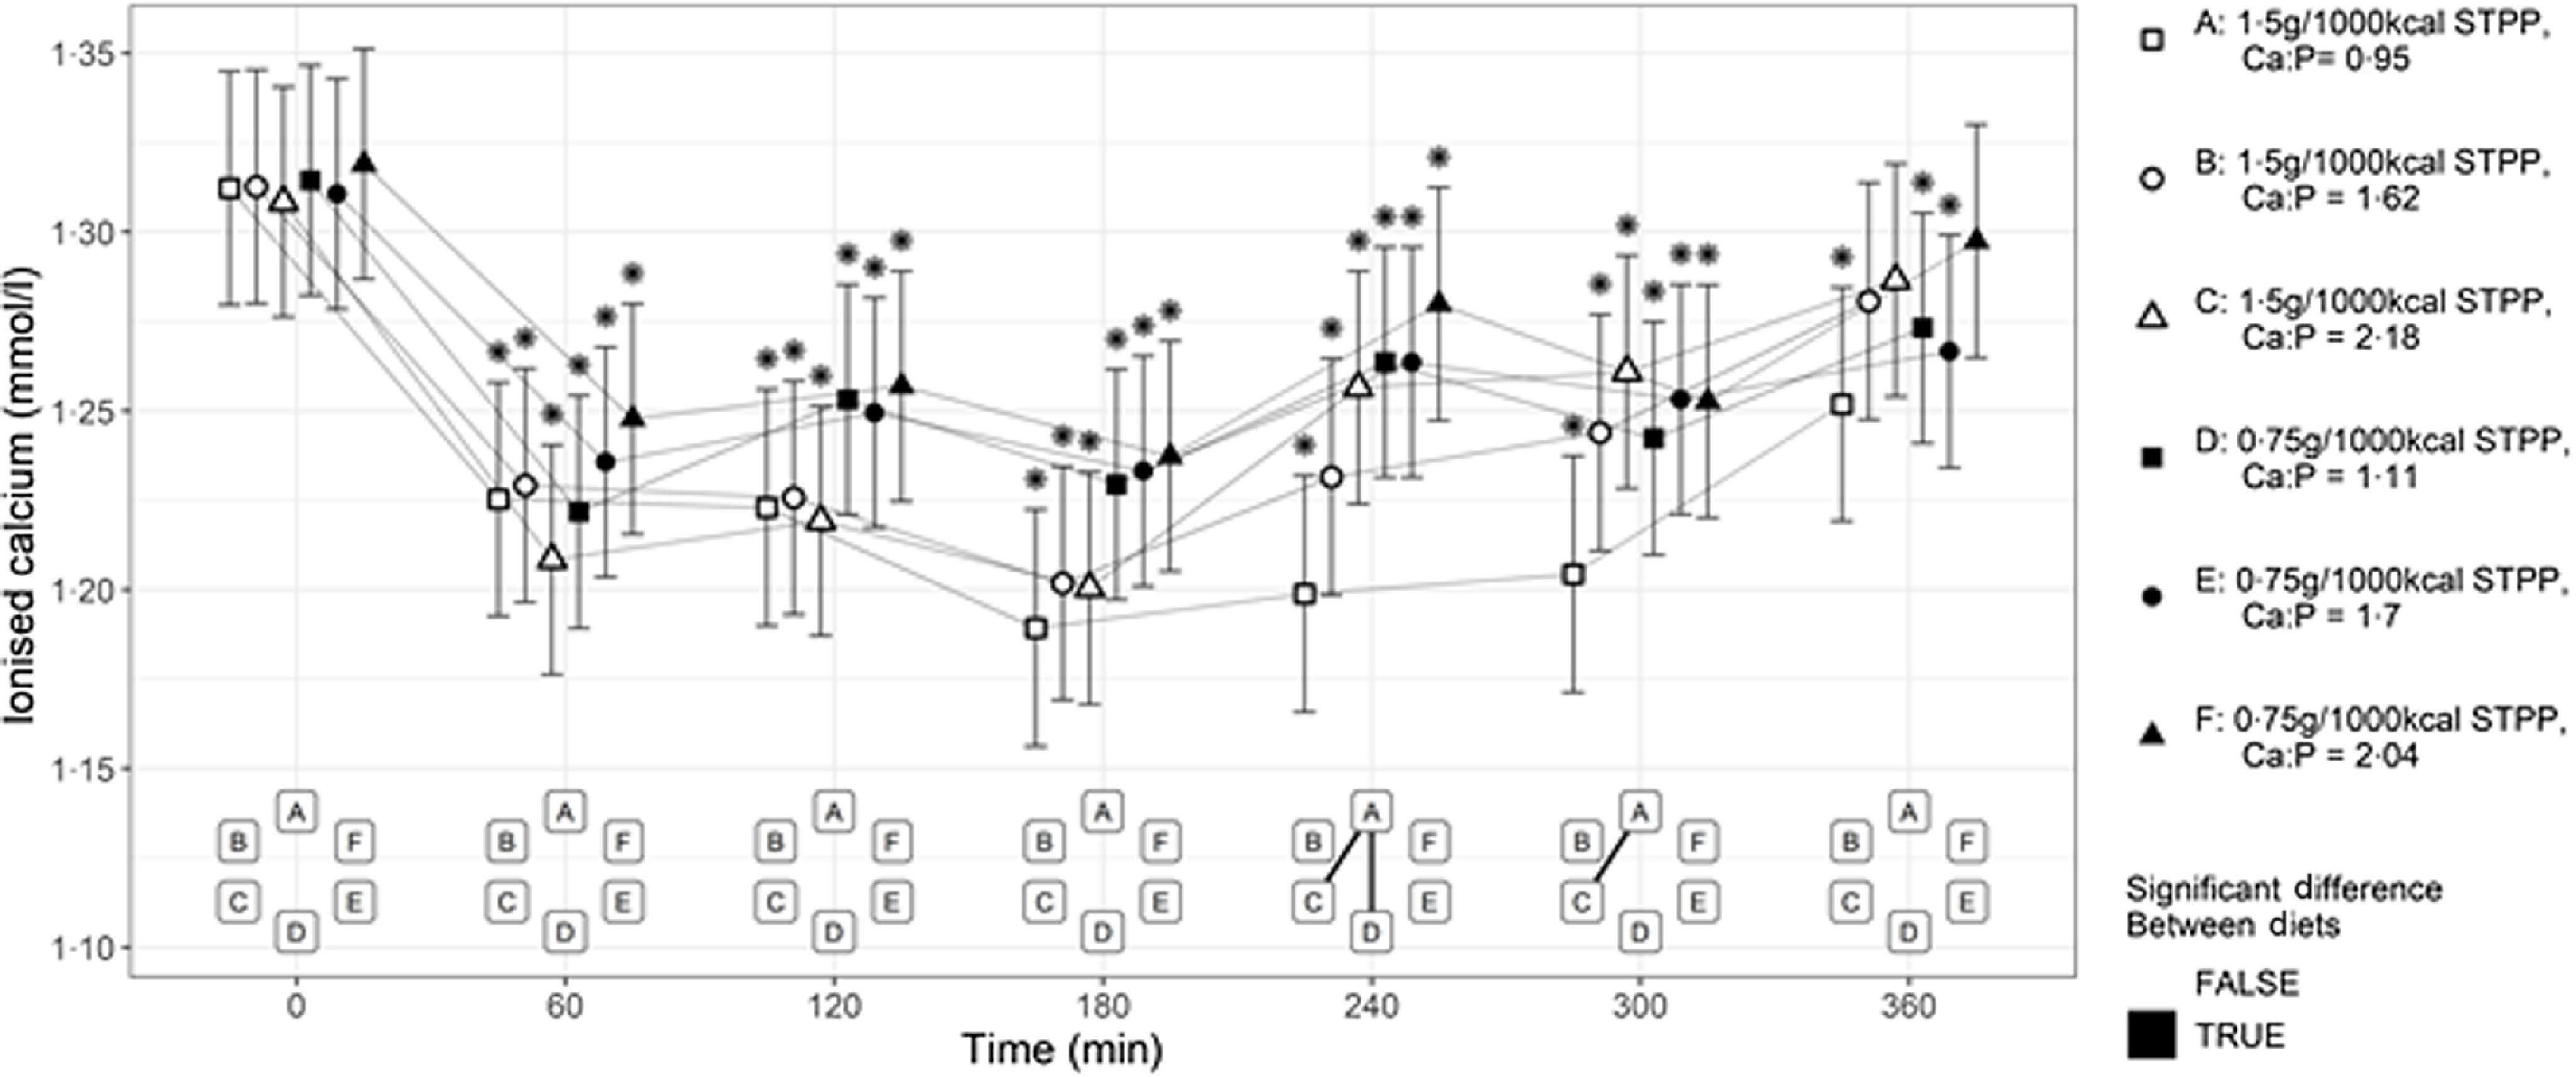
Fig. 3.

Mean whole blood ionised calcium (mmol/l) concentrations over 360 min postprandial periods following intake of a meal for each experimental diet A–F comprising 50 % of the daily metabolisable energy requirement (MER). *Significant differences to the baseline fasted sample (time 0); P ≤ 0·05. The vertical bars for each mean indicates 95 % CI. STPP, sodium tripolyphosphate.
