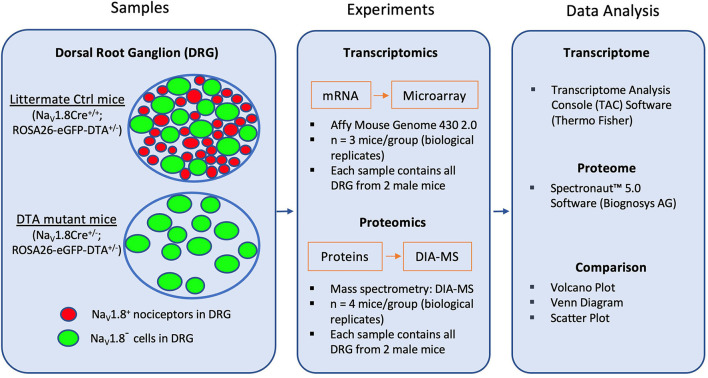
Figure 1.
Schematic diagram for transcriptome and proteome analysis in NaV1.8-expressing (NaV1.8+) DRG neurons (mainly nociceptors). The diagram shows the key steps of the workflow. First, RNA and protein samples from DRG were collected from both DTA mutant (NaV1.8Cre+/−; ROSA26-eGFP-DTA+/−) mice, in which NaV1.8+ nociceptors have been ablated, and littermate control (Ctrl) mice (Nav1.8Cre+/+; ROSA26-eGFP-DTA+/−). Isolated RNA and proteins were identified with Affymetrix microarray and Data Independent Acquisition-Mass Spectrometry (DIA-MS), respectively. Generated datasets were analyzed using Transcriptome Analysis Console (TAC) software for transcriptome profiling, and Spectronaut™ Software (Biognosys AG) for proteome profiling.

