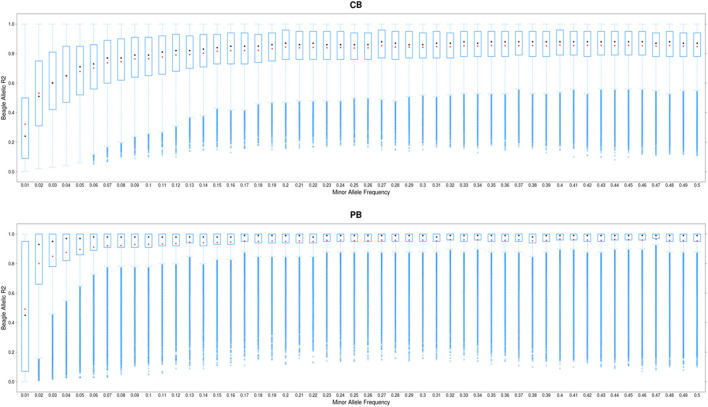
FIGURE 2.
Boxplot showing the imputation accuracy (allelic DR2) to whole-genome sequence (WGS) versus minor allele frequency (MAF) for CBs and PBs. The x-axis represents different classes of MAF (ranging from 0.01 to 0.5, with the steps of 0.01), and y-axis shows the imputation accuracies. The red and black dots are the mean and median of imputation accuracies across individuals in each MAF class.

