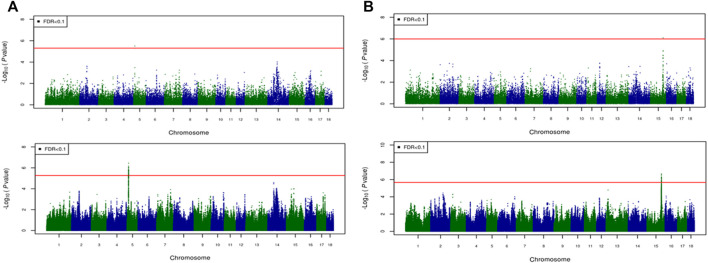
FIGURE 4.
Associated regions detected by GWAS for crossbred pigs. Manhattan plots for: (A) TMCOLA and (B) GMCOLB using a 61K medium-density panel (top Figure) and WGS (bottom Figure). The -log10 p-values of single-SNP association along the entire genome are plotted against the genomic position of SNPs along the 18 autosome chromosomes. The SNPs associated with the corresponding traits exceeded the significance threshold at false discovery rate (FDR) of 0.1, having significant effects.

