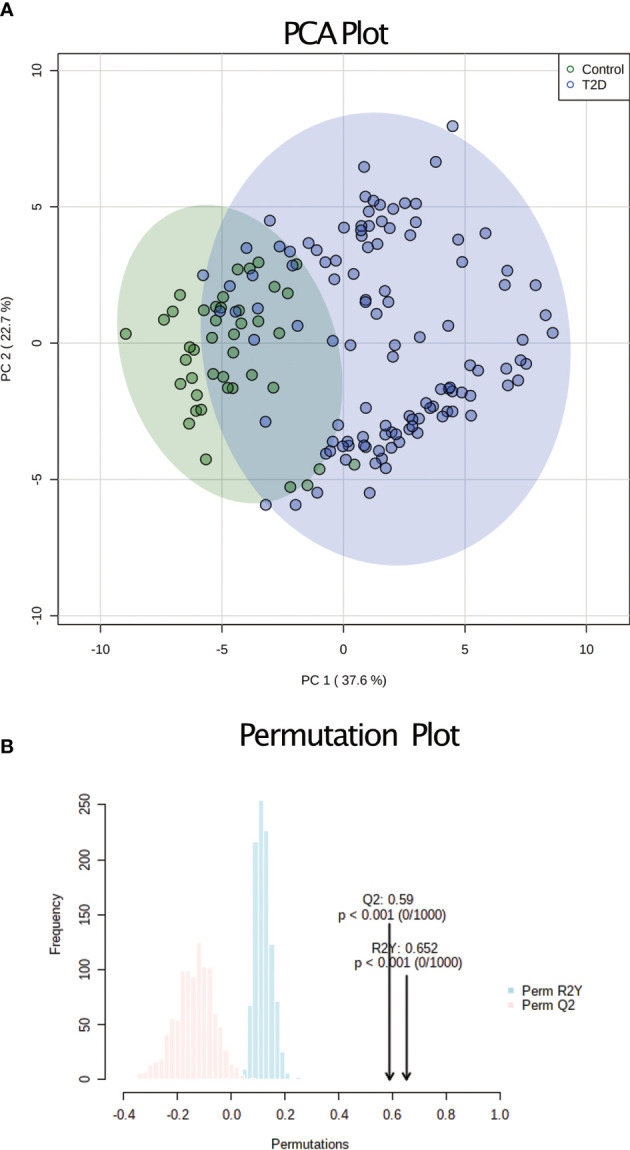
Figure 1.

Unsupervised analysis of serum metabolomics. (A) PCA analysis based on the 43 metabolites and all 155 samples. The controls are shown in green and the T2D samples in blue (B) Permutation conducted to validate the variation obtained during the PCA. The R2 (shown in blue) and Q2 (shown in red) values indicate the robustness of the PCA model.
