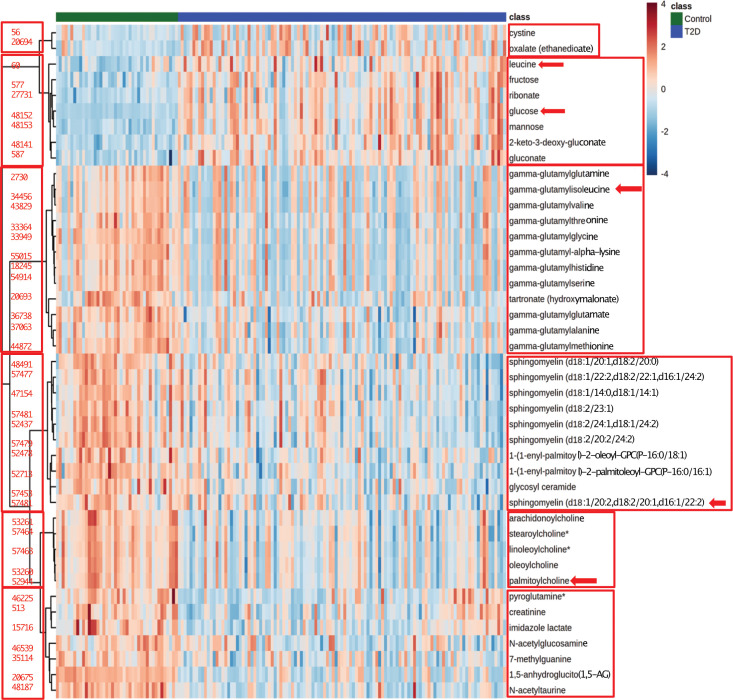
Figure 2.
Heatmap of differential levels of 43 serum metabolites. 43 metabolites that were significantly different between T2D adolescents (blue color class) and control adolescents (green color class). Red color indicates the increased and the blue indicates reduced levels. The red boxes show the six major clusters formed. On the left of cluster is shown the compound identification for the respective metabolite. The red arrows show the five metabolites that were used for data integration.

