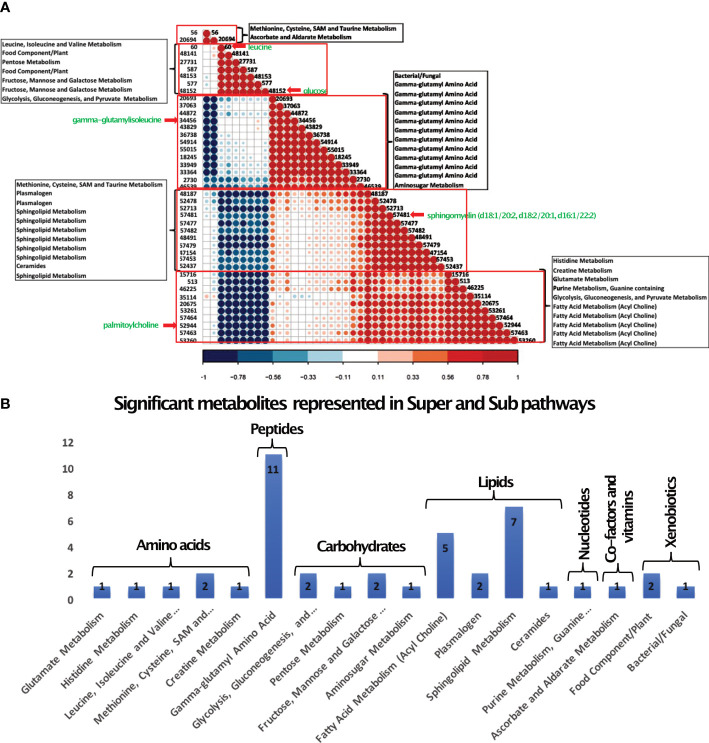
Figure 3.
Pathway analysis of Serum Metabolites. (A) Pearson correlation-based clustering of the significant metabolites. Five major clusters obtained are shown in red boxes. Each metabolite is represented by their compound identification ( Table 2 shows the respective metabolites). The sub pathways of the metabolites are represented in the boxes. The five metabolites chosen for data integration are indicated by a red arrow. (B) 43 metabolites were categorized into seven super pathways, including lipids (35%), peptides (26% gamma-glutamyl amino acids), amino acids (10%), carbohydrates (17%), nucleotide (2% purine metabolism), cofactors and vitamins (2% ascorbate and aldarate metabolism), and xenobiotics (7%).

