Figure 4.
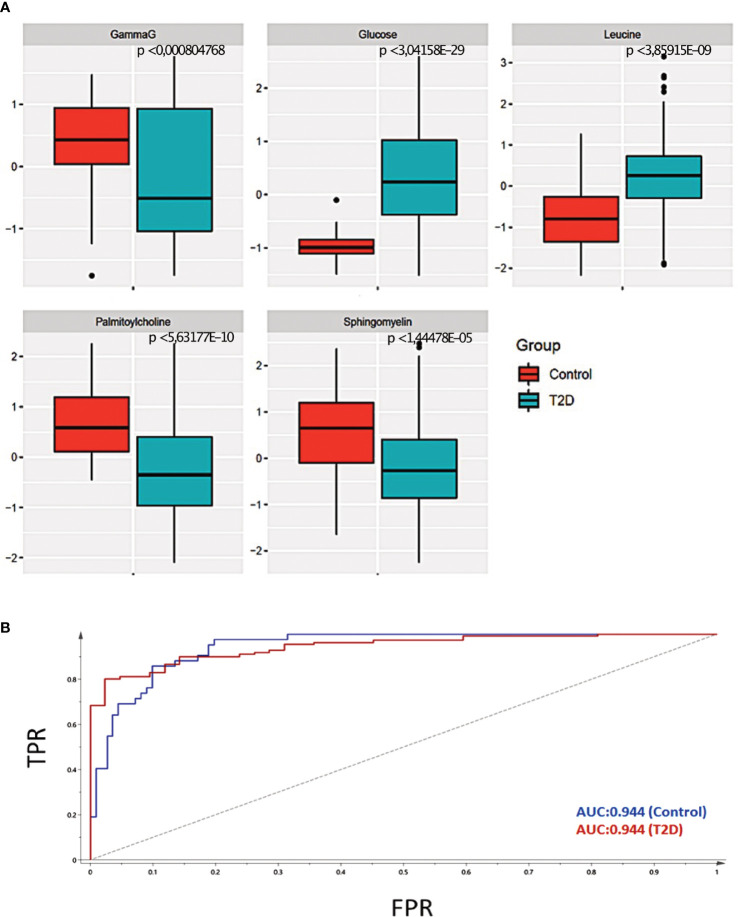
Selection of representative metabolites for data integration. (A) Statistical significance of the five selected metabolites for data integration. The p-value is estimated using an unpaired t-test. The p-value < 0.05 is considered to the significant. (B) The Area Under the Curve (AUC) of the five selected metabolites was 0.94, demonstrating a high accuracy of prediction.

