
Figure 4.
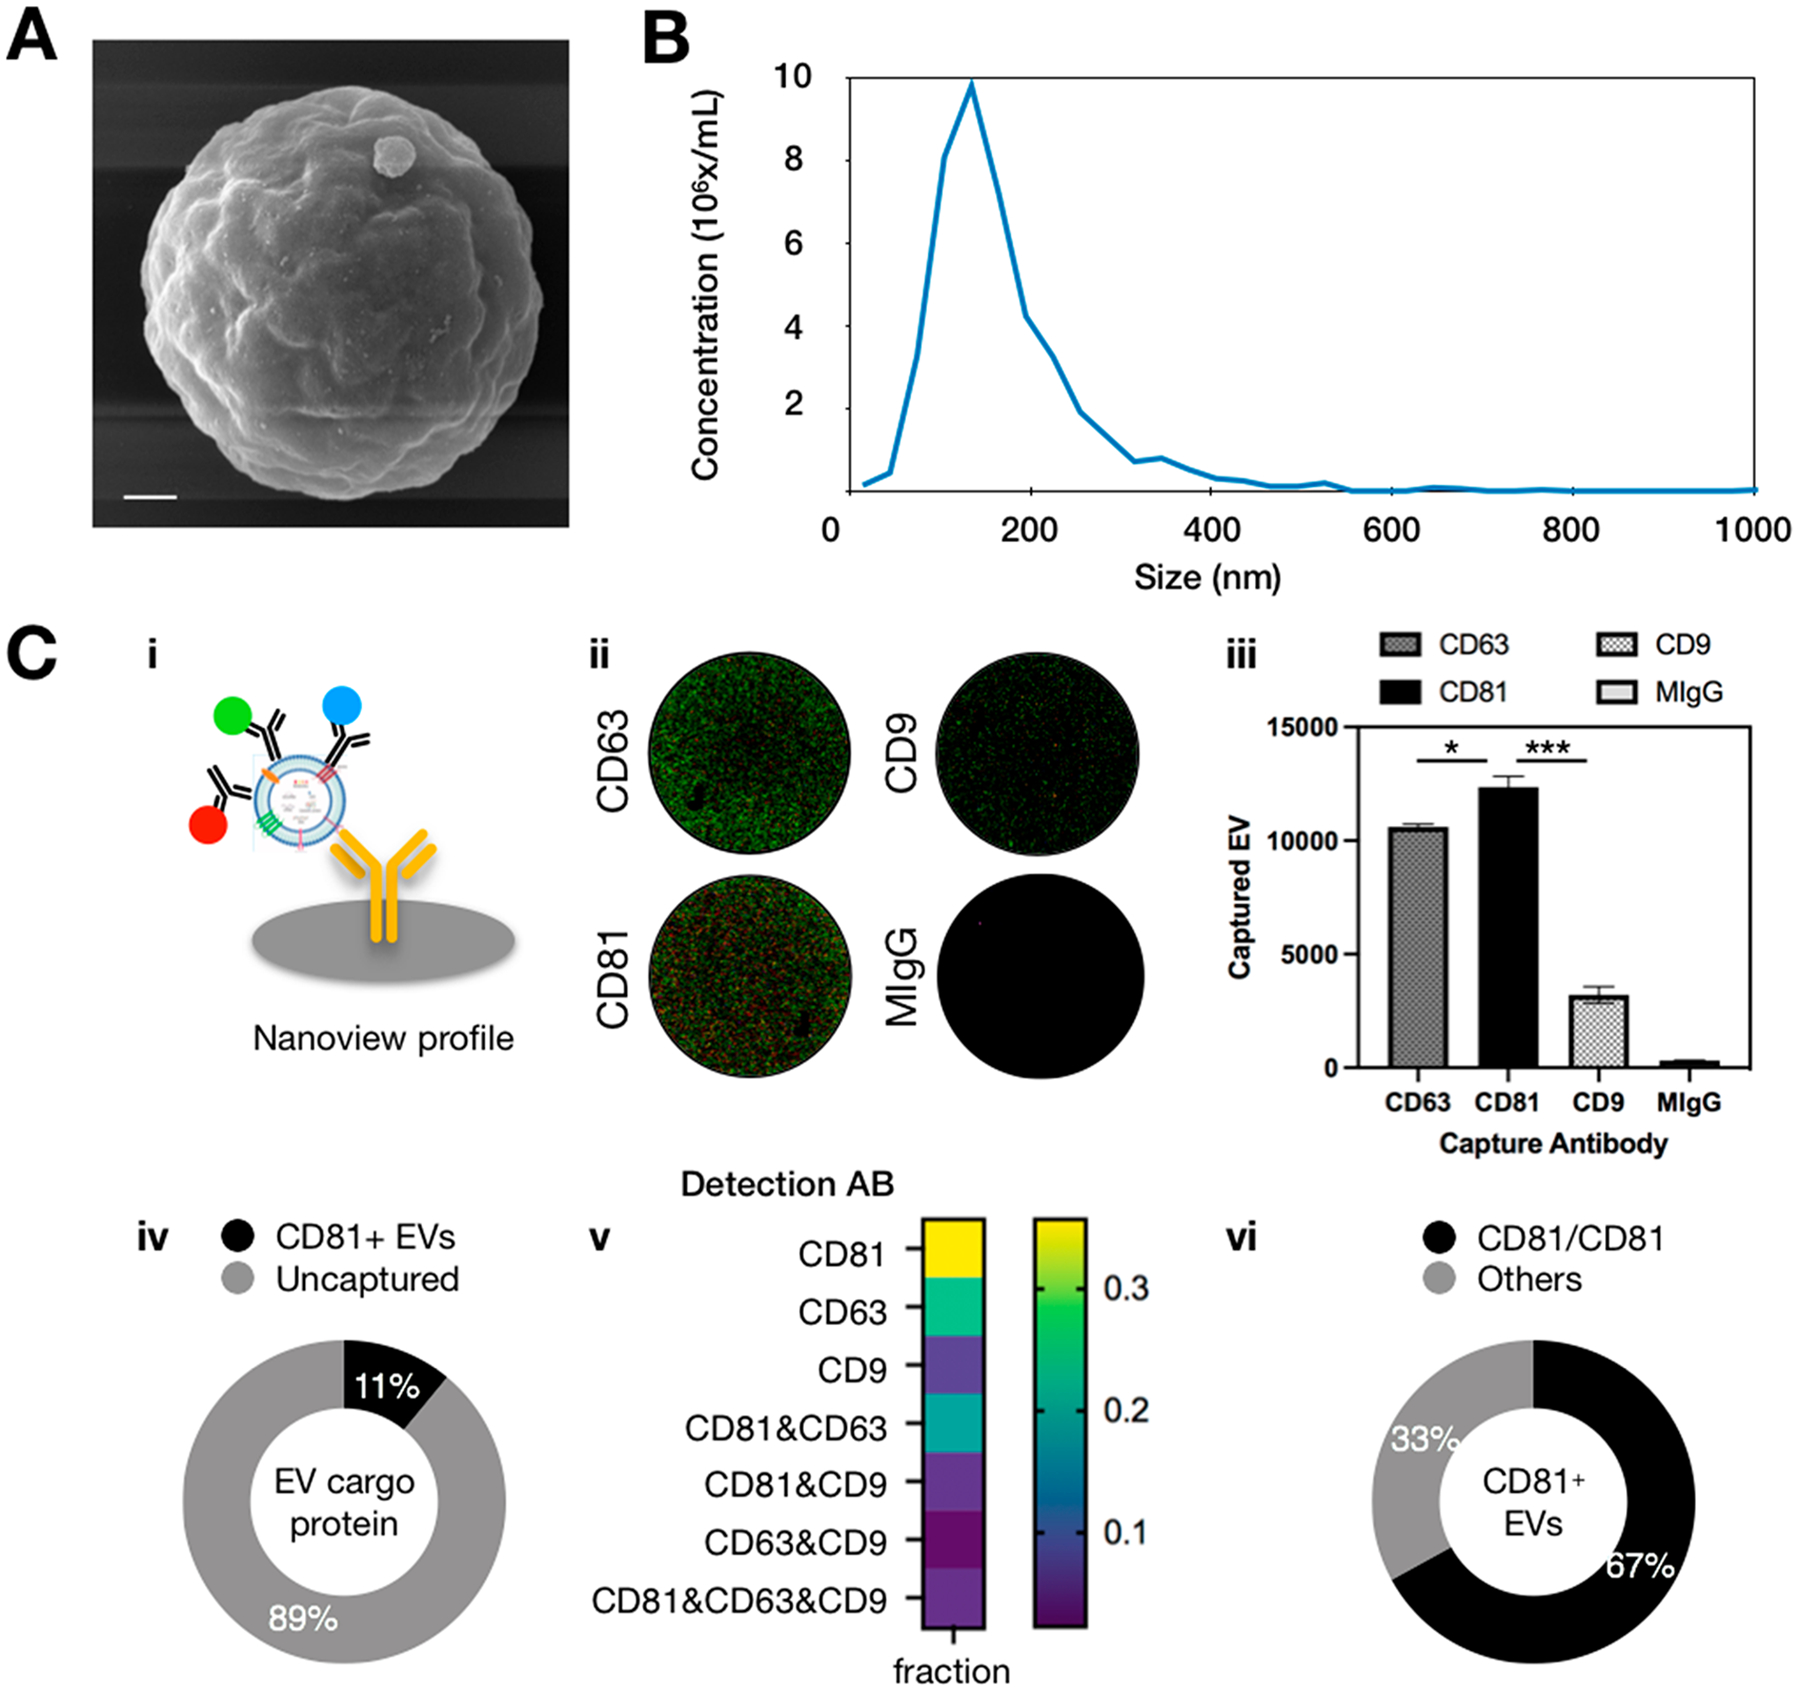
Characterization of human neuron EVs for DEVA. (A) SEM of an EV captured on an antibody-coated microbead. Scale bar: 300 nm. (B) NTA analysis of the size distribution and the concentration of human neuron derived EVs. (C) (i) Schematic of Nanoview analysis of EV surface proteins by immunocapture and immunolabeling. Red stands for CD63, green stands for CD81, blue stands for CD9. (ii) Fluorescent image recorded by Nanoview showing the surface protein profiling on captured EVs. (iii) Nanoview chip captured most human neuron EVs on the anti-CD81-coated chip. * indicates p < 0.05, *** indicates p < 0.001. (iv) Eleven percent of human neuron EVs express at least one CD81 protein based on immunoisolation and protein calibration. (v) Surface protein profiling of CD81+ EVs revealed by Nanoview. Each marker group represents a distinct EV subpopulation with no overlap. (vi) Among the CD81+ EVs, 67% of them expressed at least one other CD81 protein.