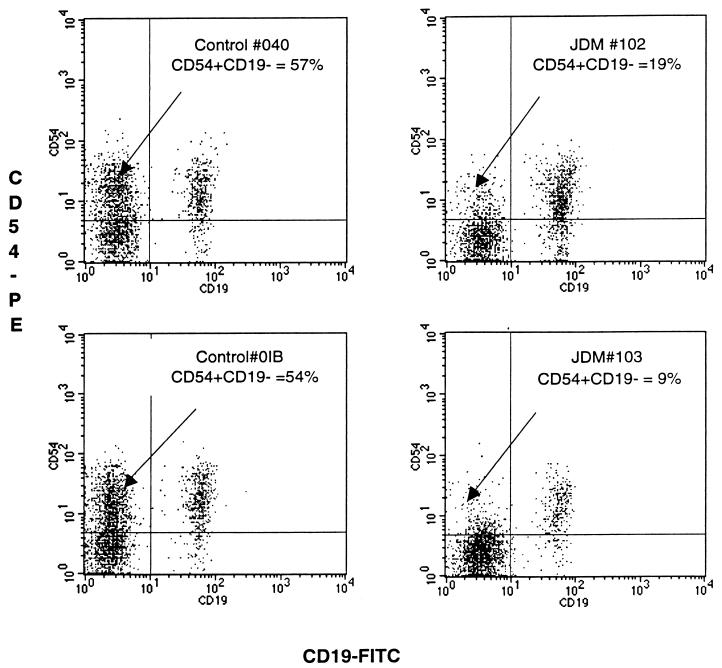
FIG. 1.
Four dot plots generated from peripheral blood samples obtained from two healthy age-related control patients (left) and two representative untreated JDM patients (right) with active disease; samples were stained with CD19-FITC (x axis) and CD54-PE (y axis). The events illustrated in each dot plot were generated from lymphocytes electronically gated by characteristic forward versus right angle light scatter signals (see Materials and Methods). Note the apparent decrease in the CD54+ CD19− subset in the upper left hand quadrant of each histogram of the JDM patients (19 and 9%) compared to the two healthy controls (57 and 54%).

