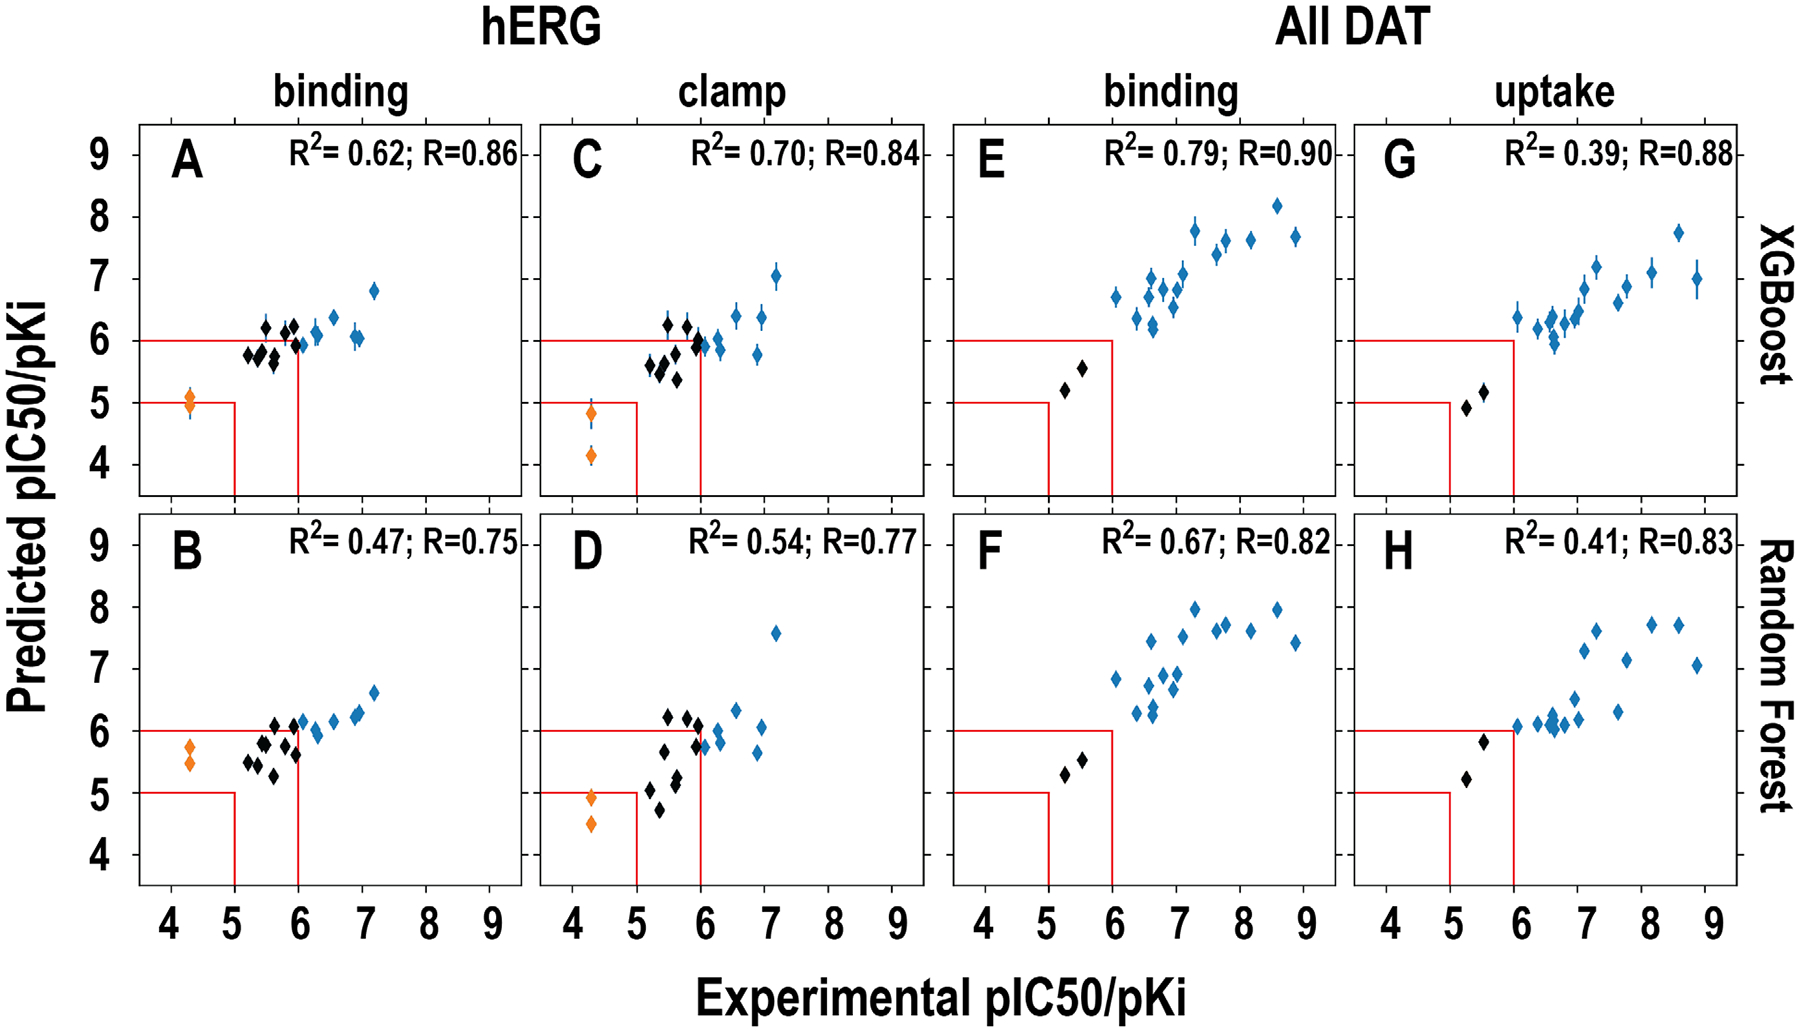
Figure 3. Correlations between the predicted and experimentally measured hERG and DAT affinities.

The models in the upper row (A, C, E, G) used XGBoost and those in bottom row (B, D, F, H) used RF in training. The specific datasets used for training, i.e., binding and clamp for hERG and binding and uptake for DAT, are indicated on top of each column. The results of classification prediction are color-coded. The blue and red represent binder and non-binder, respectively. The compounds that have been experimentally measured to have pIC50 or pKi between 5 and 6 are colored in black. The red lines indicate the regions that <5 and >6 are defined as non-binder and binder, respectively. Note that among 18 compounds in this set, ten of them have been published previously13, 45, 46.
