
Figure 2.
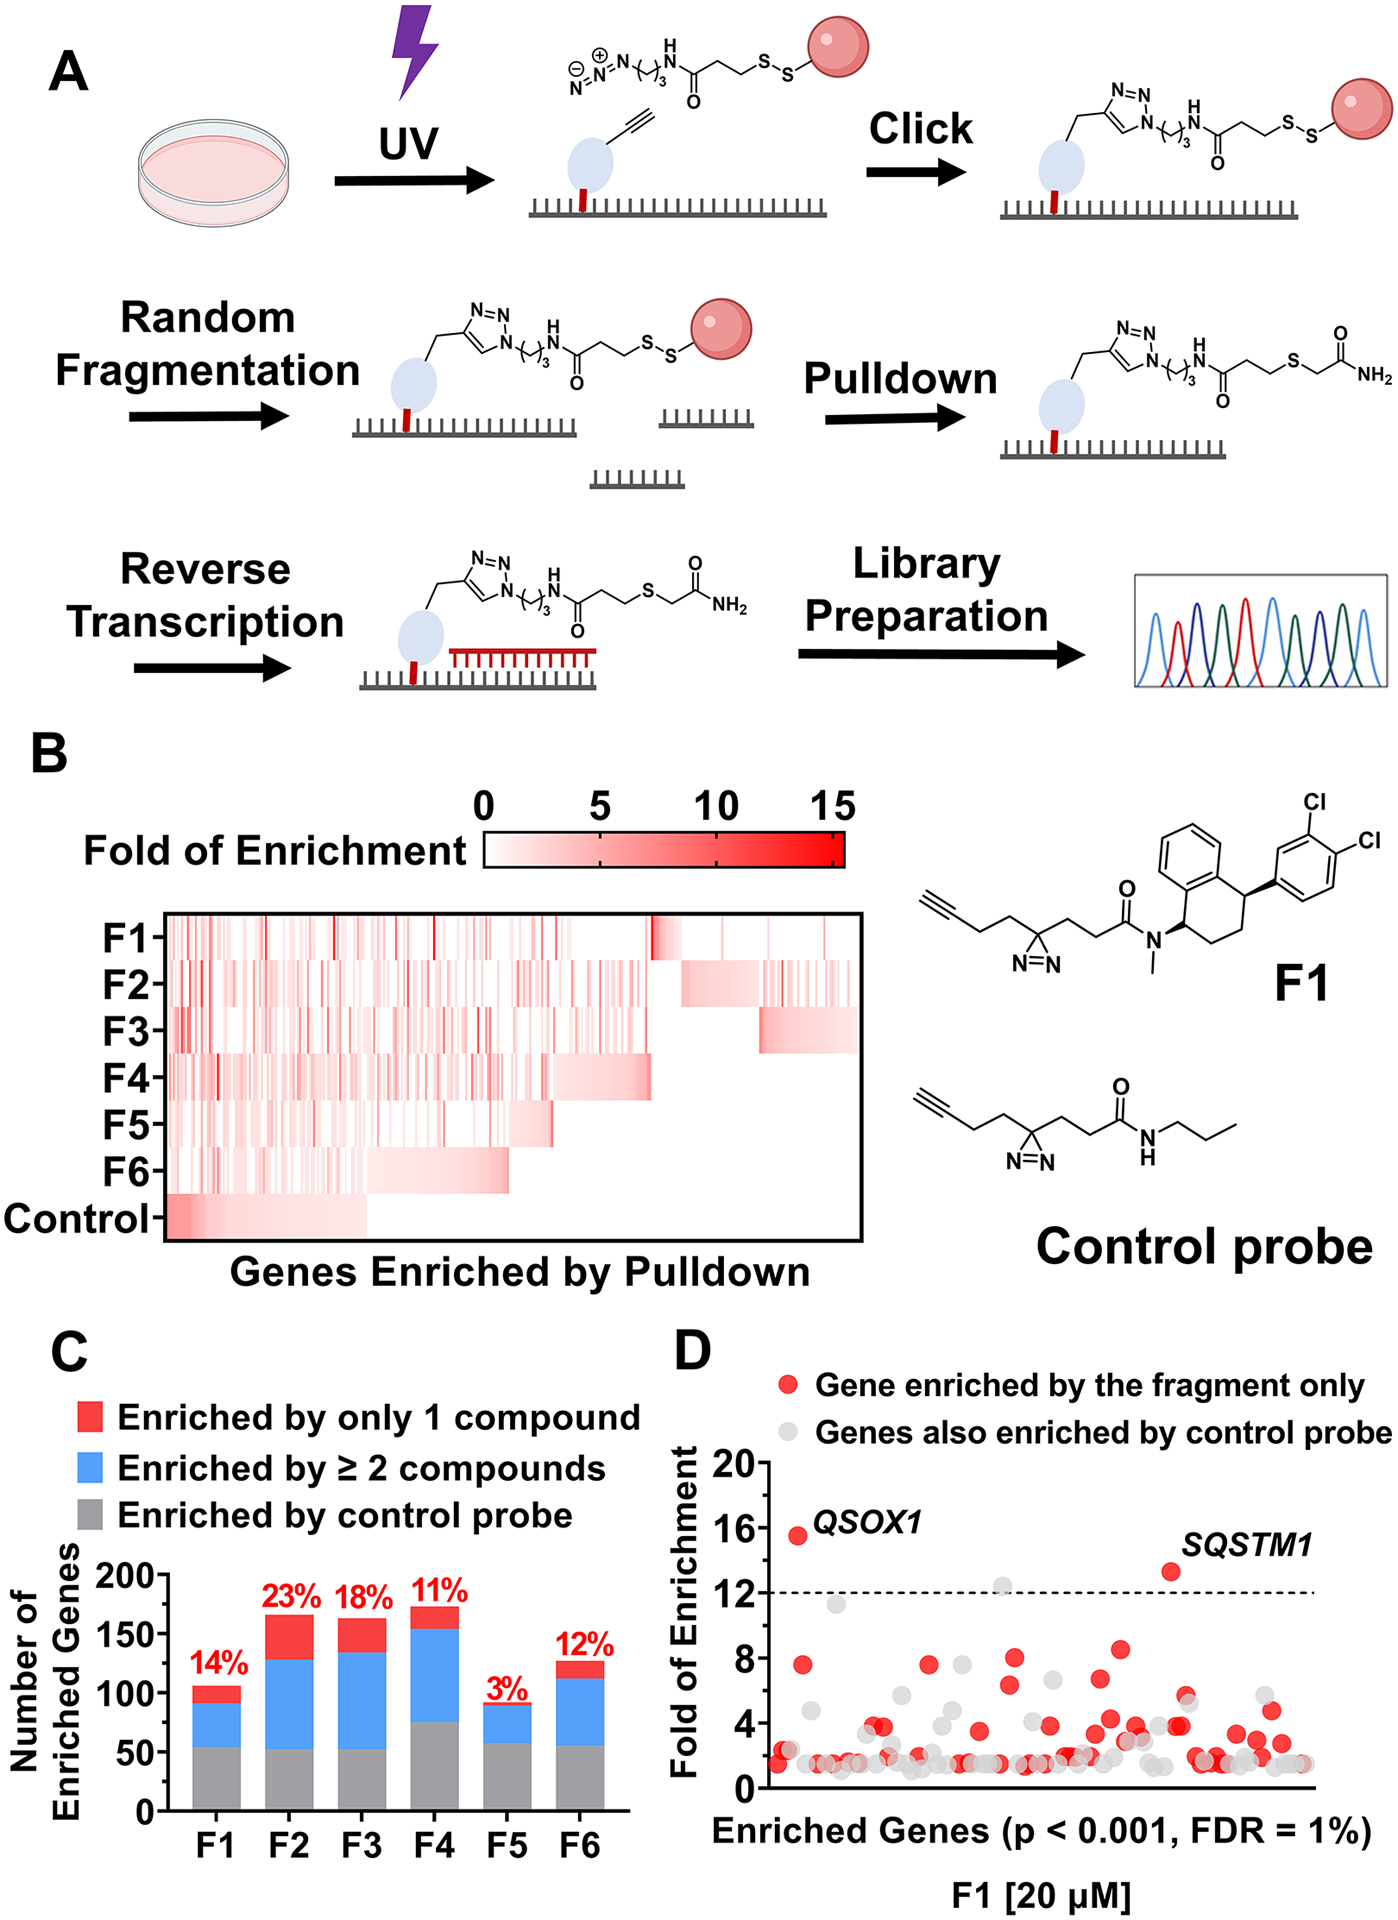
Chem-CLIP-Map-Seq profiles the targets of compounds across the human transcriptome in cellulis. (A) Schematic depiction of the Chem-CLIP-Seq workflow. (B) Heatmap representation of genes enriched by each compound. (C) Comparisons of genes enriched by each compound. (D) Genes that are significantly enriched by F1 identified by Chem-CLIP-Seq in MDA-MB-231 cells.