
Figure 3.
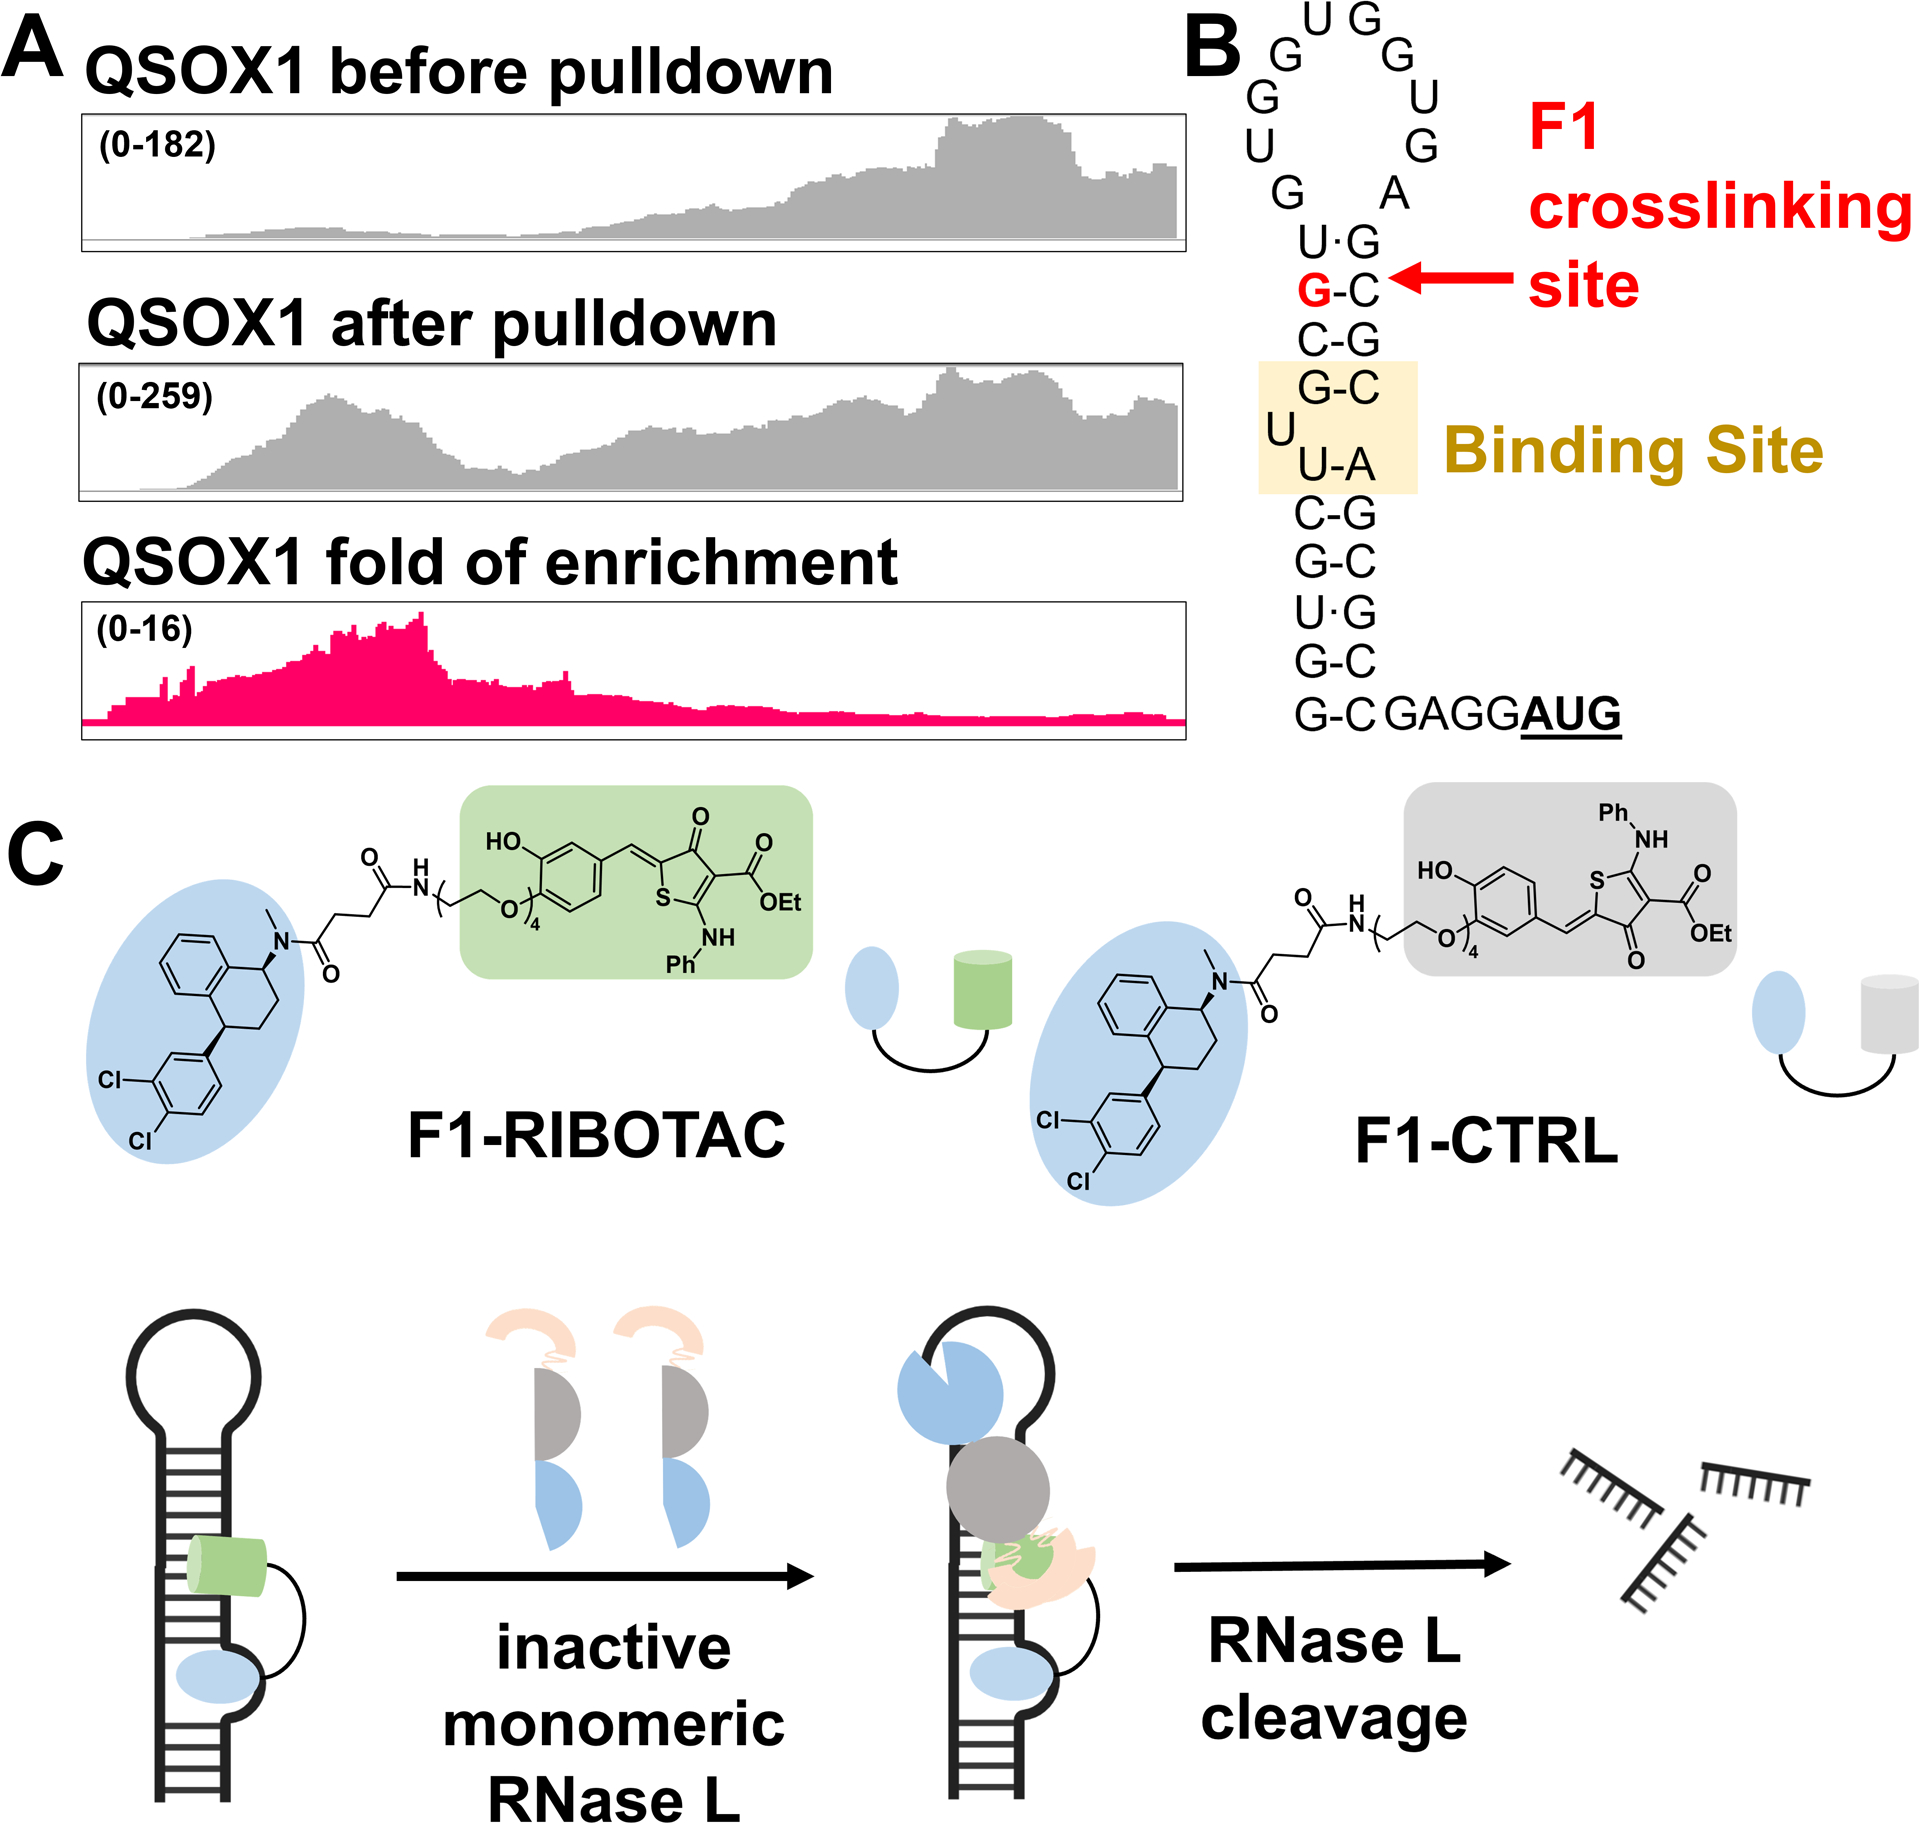
The F1 binding site was mapped to QSOX1 5’ UTR and F1 was subsequently converted to an RNA degrader. (A) RNA-seq tracks showing regions of the QSOX1 transcript enriched by F1 in cells. (B) The RNA sequence and structure nearby the mapped F1 cross-linking site. (C) Structures of F1-RIBOTAC that recruits RNase L, and F1-CTRL that is >20-fold less active in recruiting RNase L.