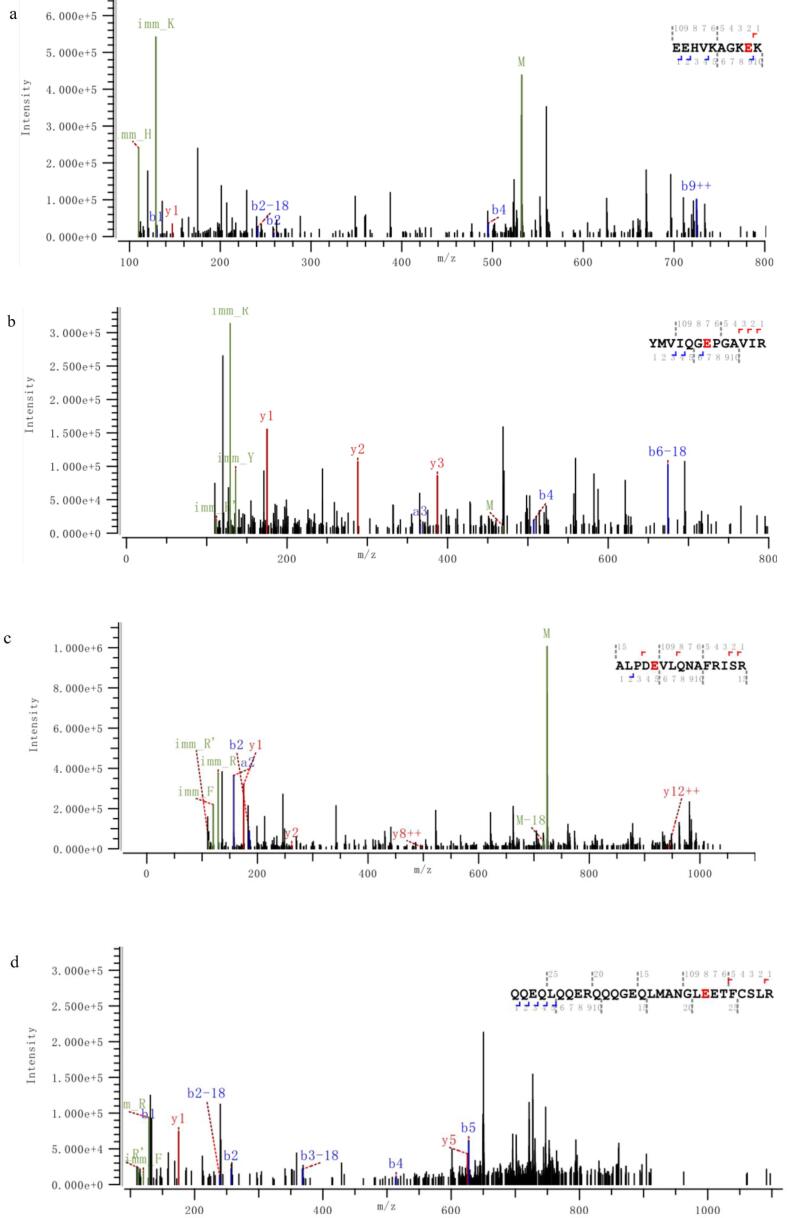
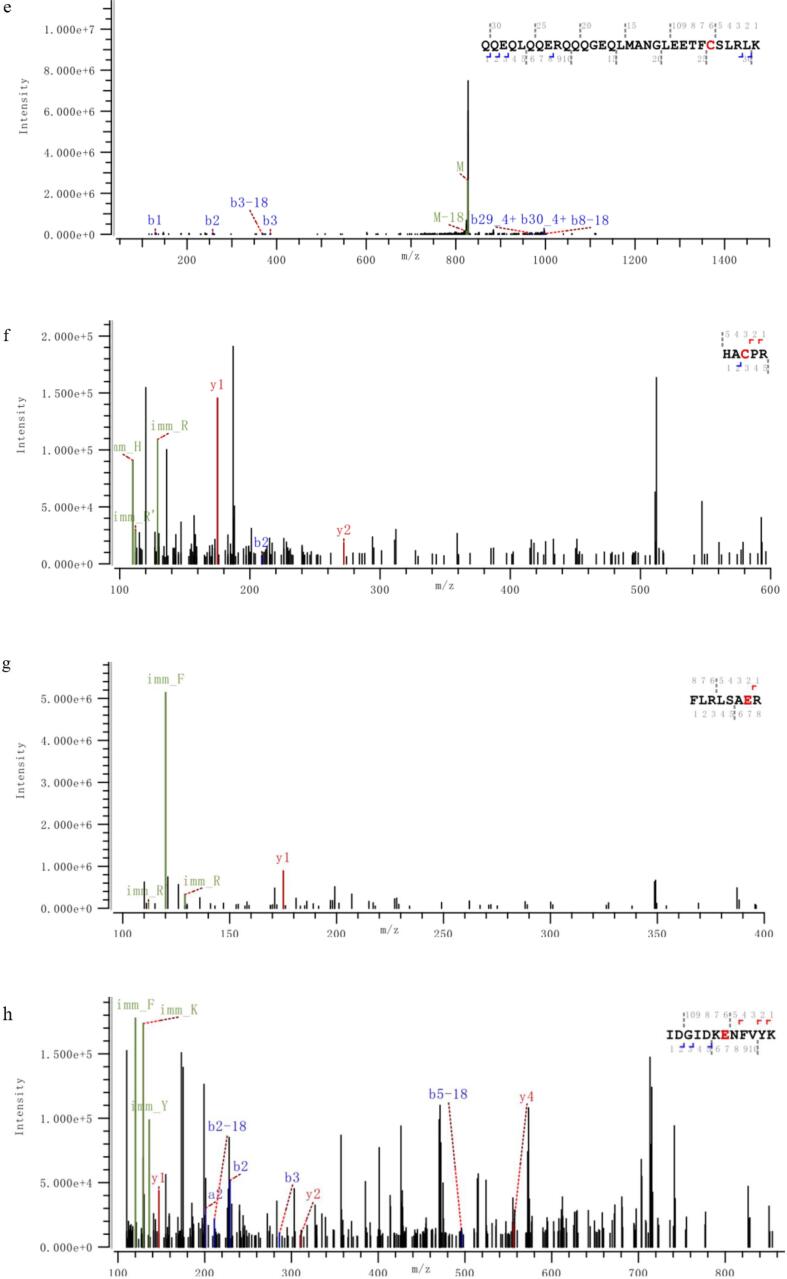
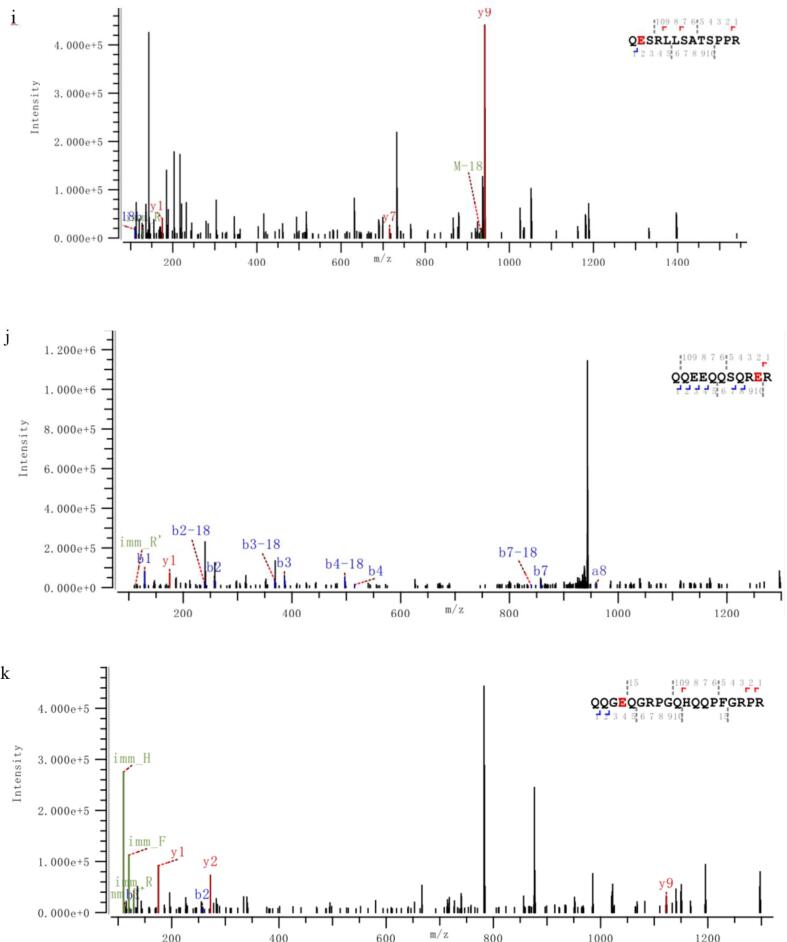
Fig. 6.
The M/Z spectrum of the LC-MS /MS of the peptides hydrolyzed by the amandin-EGCG conjuage in the ultrasound-assisted alkaline method and the ultrasound-assisted free radical method, in which A–E was the ultrasound-assisted alkaline method and F–K was the ultrasound-assisted free radical method. The peptide sequences marked in red are the amino acid residues that AMP and EGCG may bind to detected by LC-MS/MS. (For interpretation of the references to colour in this figure legend, the reader is referred to the web version of this article.)


