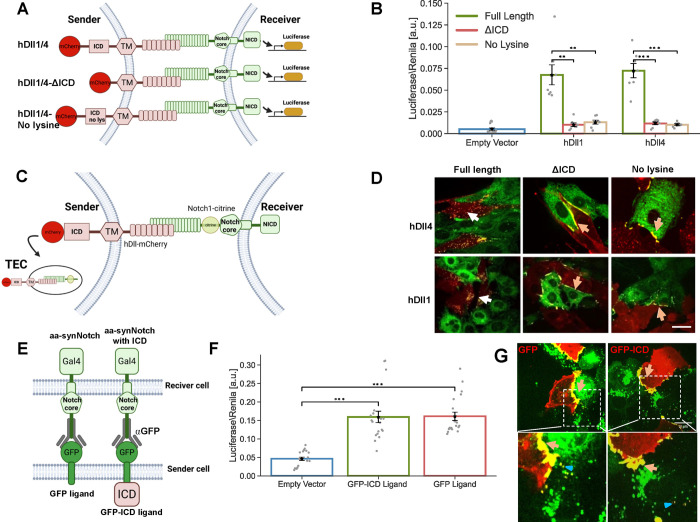
Figure 1.
ICD of Notch ligands is required for Notch activity in the endogenous system, but not in the aa-synNotch system. (A) Schematic of the Notch luciferase activity assay. In this assay, sender cells that express the Notch ligands Dll1 or Dll4 (hDll1/4) activate a Notch luciferase reporter in the receiver cells. (B) Luciferase activity assay showing the activation of a Notch reporter cell line (CHO-Notch1 transfected with a 12xCSL-Luciferase reporter) co-cultured with CHO-TetR cells expressing either wildtype hDll1/4 (hDll1/4), hDll1/4 lacking its ICD (hDll1/4-ΔICD), or hDll1/4 with no lysine residues in its ICD (hDll1/4-no lysine). (C) A schematic of the live-cell TEC assay where inducible hDll1/4 (and its variants) are co-cultured with Notch1 fused to citrine in its NECD (Notch1-Citrine). (D) Images showing a co-culture of inducible hDll1/4 variants (red) with Notch1-citrine cells (green) 10 h after induction of ligand expression with 100 ng/mL dox. While the full-length hDll1/4 exhibits strong TEC (white arrows), both hDll1/4-ΔICD and hDll1/4-no lysine show accumulation on the boundaries (orange arrows). (E) Schematic of an aa-synNotch system with a receiver cell expressing an αGFP receptor, and a sender cell expressing either a GFP ligand, or a GFP ligand with hDll4ICD (GFP-ICD). (F) Luciferase activity assay with U2OS cells expressing αGFP receptors co-cultured with U2OS cells expressing either GFP or GFP-ICD ligands; (G) images showing co-culture of U2OS-GFP or GFP-ICD ligands (red) with U2OS-αGFP-mCherry receptors (green). Both ligands (GFP or GFP-ICD) show strong accumulation on the boundaries between receiver and sender cells (orange arrows) and no TEC is observed. Low levels of reverse TEC in the receiver cells are observed (blue triangle). Data points show mean values from n = 7 for (B), and n = 20 for (F), from three and five independent experiments, respectively. Error bars represent S.E.M. **p < 0.01, ***p < 0.001. Scale bars-10 μm.

