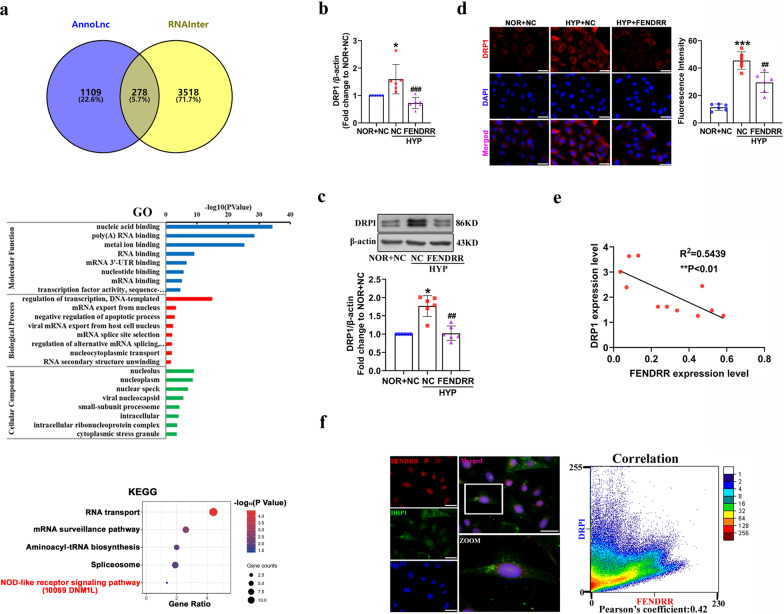
Fig. 3.
DRP1 is regulated by FENDRR in HPAECs. a AnnoLnc and RNAInter bioinformatics software predicted FENDRR target proteins, and Gene Ontology (GO) and Kyoto Gene and Genomic Encyclopedia (KEGG) analysis of 278 genes in intersection. b Expression of DRP1 quantified by qRT-PCR (n = 5). c Western blot was used to verify the expression of DRP1 (n = 5). d Fluorescence staining for DRP1. HPAECs were stained for DRP1 (red) and DAPI (blue) was used for nuclear staining. Scale bar = 50 μm. e Analysis of the correlation between FENDRR and DRP1 in HPAECs. f Colocalization of FENDRR and DRP1in HPAECs. Scale bars = 50 µm. FENDRR probes were labeled with Cy3 (red), DRP1 were stained with FITC (green) and nuclei were stained with DAPI (blue). Pearson coefficient is 0.42, indicating no correlation. Each datapoint in the figure represents a unique biological replicate. All values are presented as the mean ± SD. Statistical analysis was performed with one-way ANOVA. NOR: normoxic; HYP: hypoxic; NC: negative control. *P < 0.05, **P < 0.01, ***P < 0.001 compared with NOR + NC. #p < 0.05, ##p < 0.01, ###p < 0.001 compared with HYP + NC

