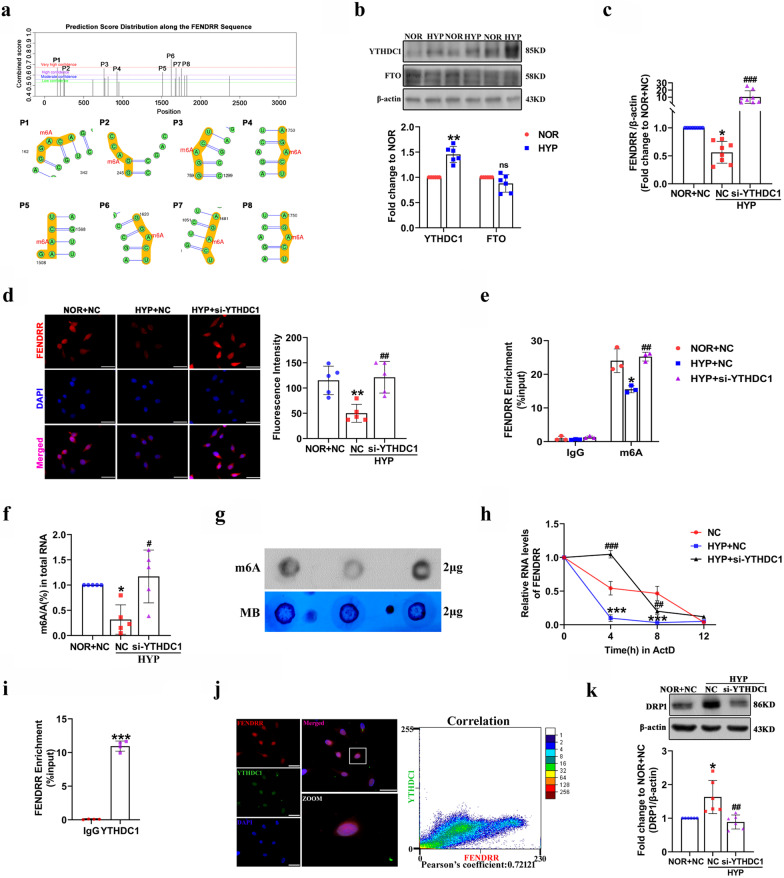
Fig. 6.
YTHDC1 binds m6A modified FENDRR to decrease its stability. a SRAMP predicted m6A sites of FENDRR. b Western blotting was used to verify the expression of YTHDC1 and FTO under hypoxic conditions (n = 6). c qRT-PCR detection of FENDRR expression (n = 8). d FISH assay was performed to detect FENDRR expression. Scale bars = 50 µm. FENDRR probes were labeled with Cy3 (red) and nuclei were stained with DAPI (blue). e The m6A levels of FENDRR were quantified by MeRIP followed by qRT–PCR (n = 3). f and g EpiQuik m6A RNA Methylation Quantification Kit and Dot blot were used to detect global m6A modifications in total HPAECs RNAs (n = 5). h The qRT-PCR analysis of FENDRR levels after ActD (1 µg/mL) treatment at 0 h, 4 h, 8 h and 12 h (n = 4). i RNA RIP assay was performed to detect FENDRR interacts with the YTHDC1 protein (n = 4). j Colocalization of FENDRR and YTHDC1 in HPAECs. Scale bars = 50 µm. FENDRR probes were labeled with Cy3 (red), YTHDC1 were stained with FITC (green) and nuclei were stained with DAPI (blue). Pearson coefficient is 0.72121, indicating correlation. k After transfection with YTHDC1 siRNA, Western blotting was used to examine the protein levels of DRP1 (n = 6). Each datapoint in the figure represents a unique biological replicate. All values are presented as the mean ± SD. Statistical analysis was performed with one-way ANOVA or the Student’s t-test. NOR: normoxic; HYP: hypoxic; NC: negative control; ns: no significant. *P < 0.05, **P < 0.01, ***P < 0.001 compared with NOR + NC. ###p < 0.001, ##p < 0.01, #p < 0.05 compared with HYP + NC

