
Figure 2.
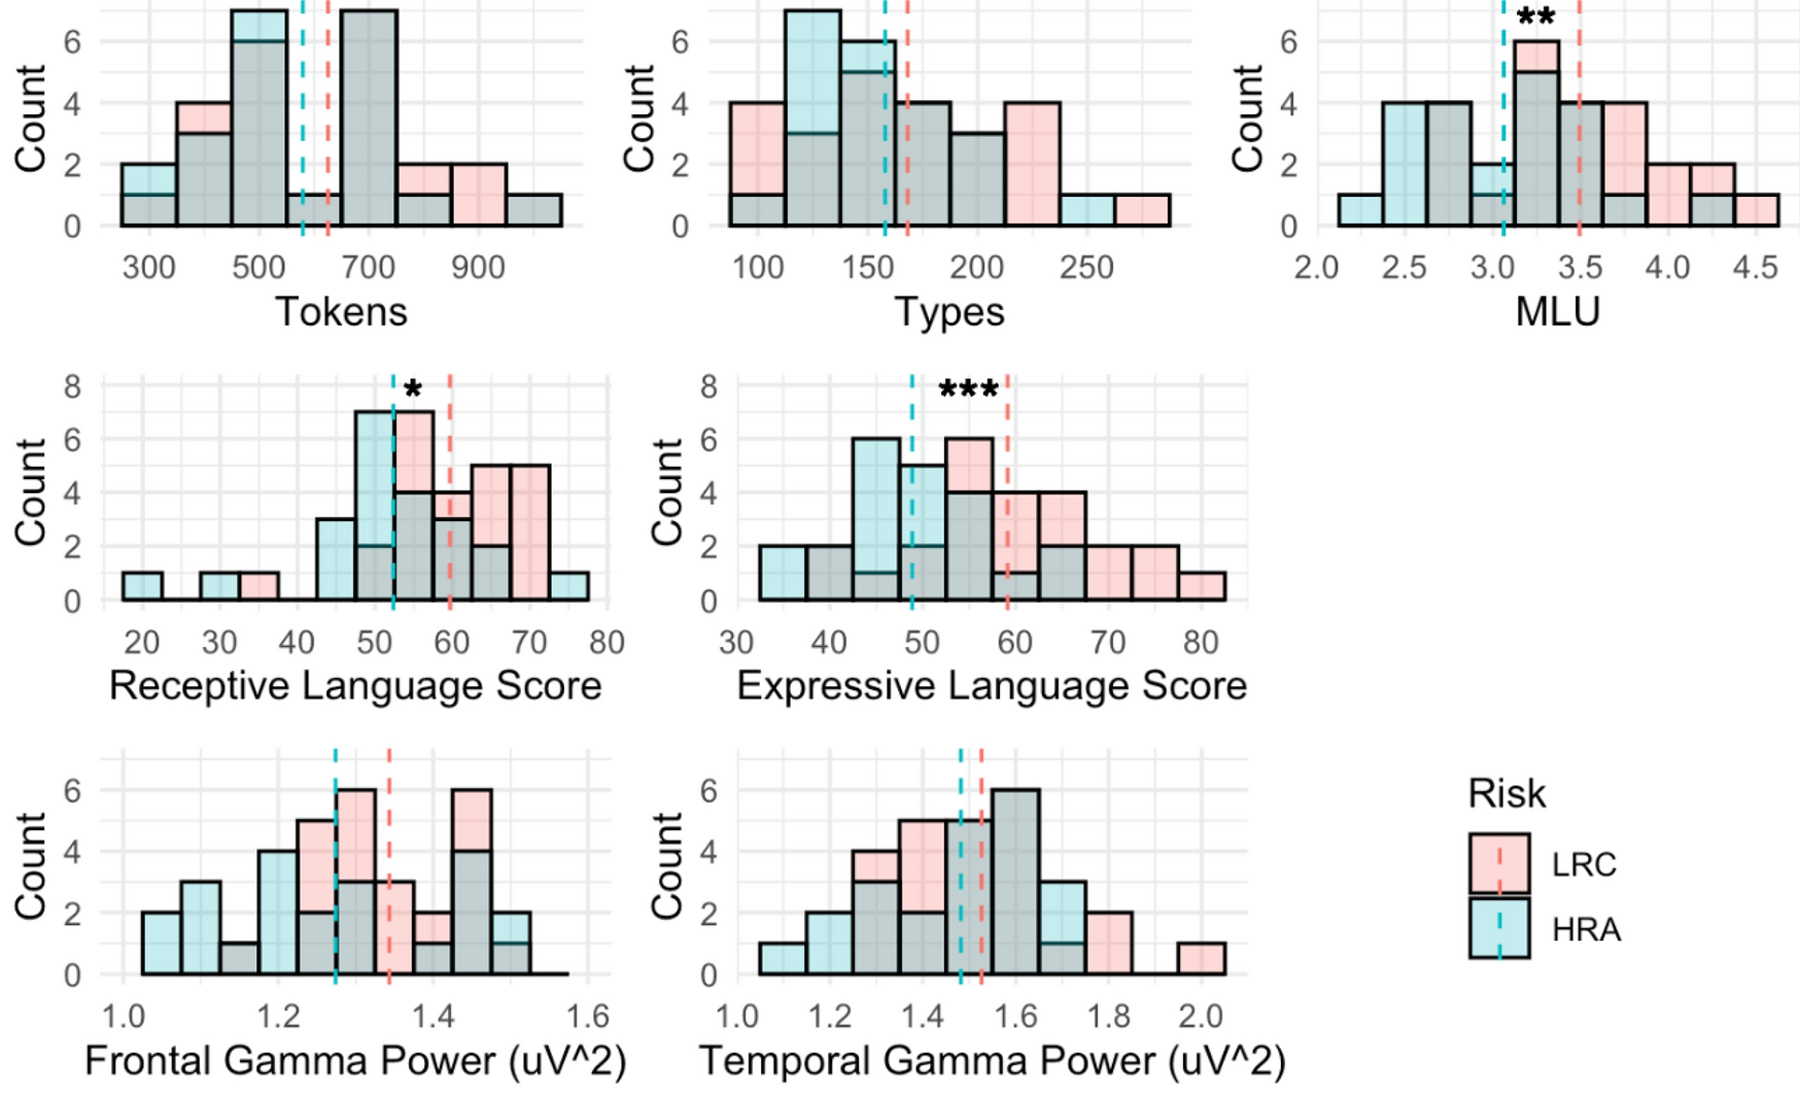
Distributions of primary measures by risk group. The top row displays language input measures; the middle row displays scores on the language assessments of the Mullen Scales of Early Learning; and the bottom row displays the log10-transformed absolute power in the gamma band (30–50 Hz) over frontal and temporal scalp regions. Group means are represented by dashed lines, and asterisks indicate significant between-group differences according to Welch’s t-test. MLU= Mean Length of Utterance; LRC = low risk control; HRA = high risk of Autism. *p < .05, **p < .01, ***p < .001