Figure 2.

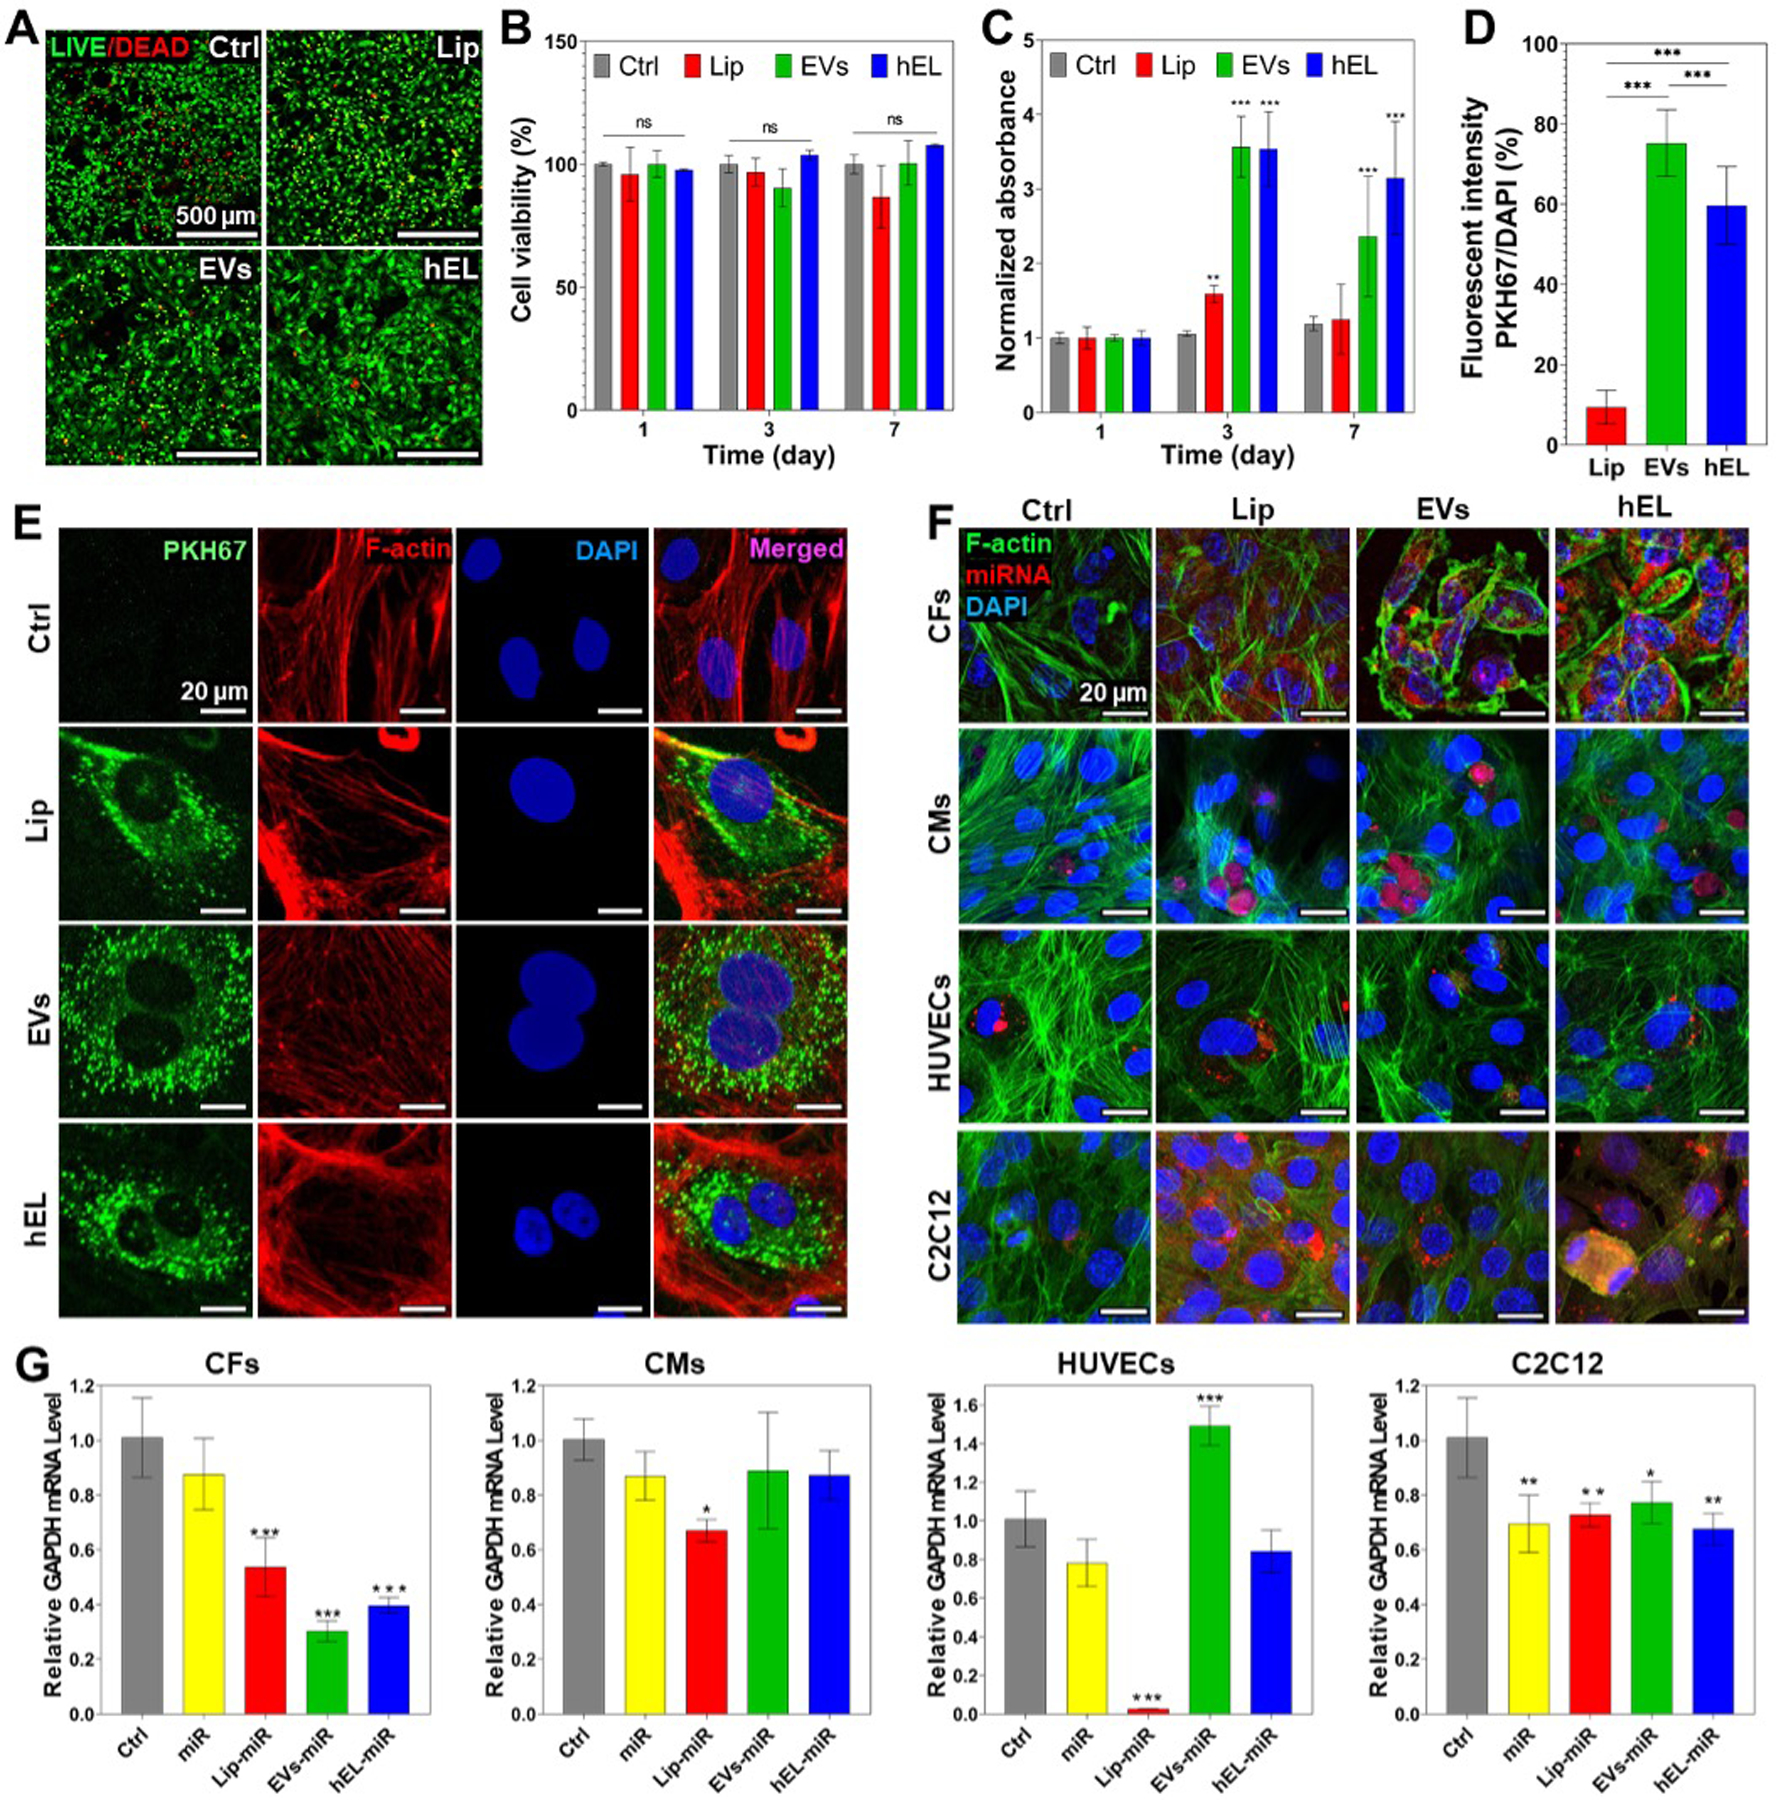
Comparison of viability and cellular uptake of NVs. (A) Live/dead images of CFs cultured with NVs (100 μg/mL) on day 7. (B) Quantified viability of CFs cultured with NVs (100 μg/mL) for 7 days (n=3). (C) PrestoBlue results showing the cell proliferation of CFs cultured with 100 μg/mL NVs for 7 days (n=3). (D) Percentages of fluorescent intensities of PKH67-labeled NVs quantified and normalized with cell number (n=10). (E) Fluorescence images of PKH67-labeled NVs (green) uptake by CFs stained with F-actin (red) and DAPI (blue) after transfection for 48h. (F) Confocal images of CFs, CMs, HUVECs, and C2C12 cells stained with F-actin (green) and DAPI (blue) after transfection for 48h with NVs loaded with miRNA DY547 (red). (G) Data representing RT-PCR of mRNA GAPDH expression of CFs, CMs, HUVECs, and C2C12 cells cultured with miRNA GAPDH loaded in NVs (n=3). All data are expressed as mean ± standard deviation. Significance is indicated as *(p < 0.05), **(p < 0.01) and ***(p < 0.001).
