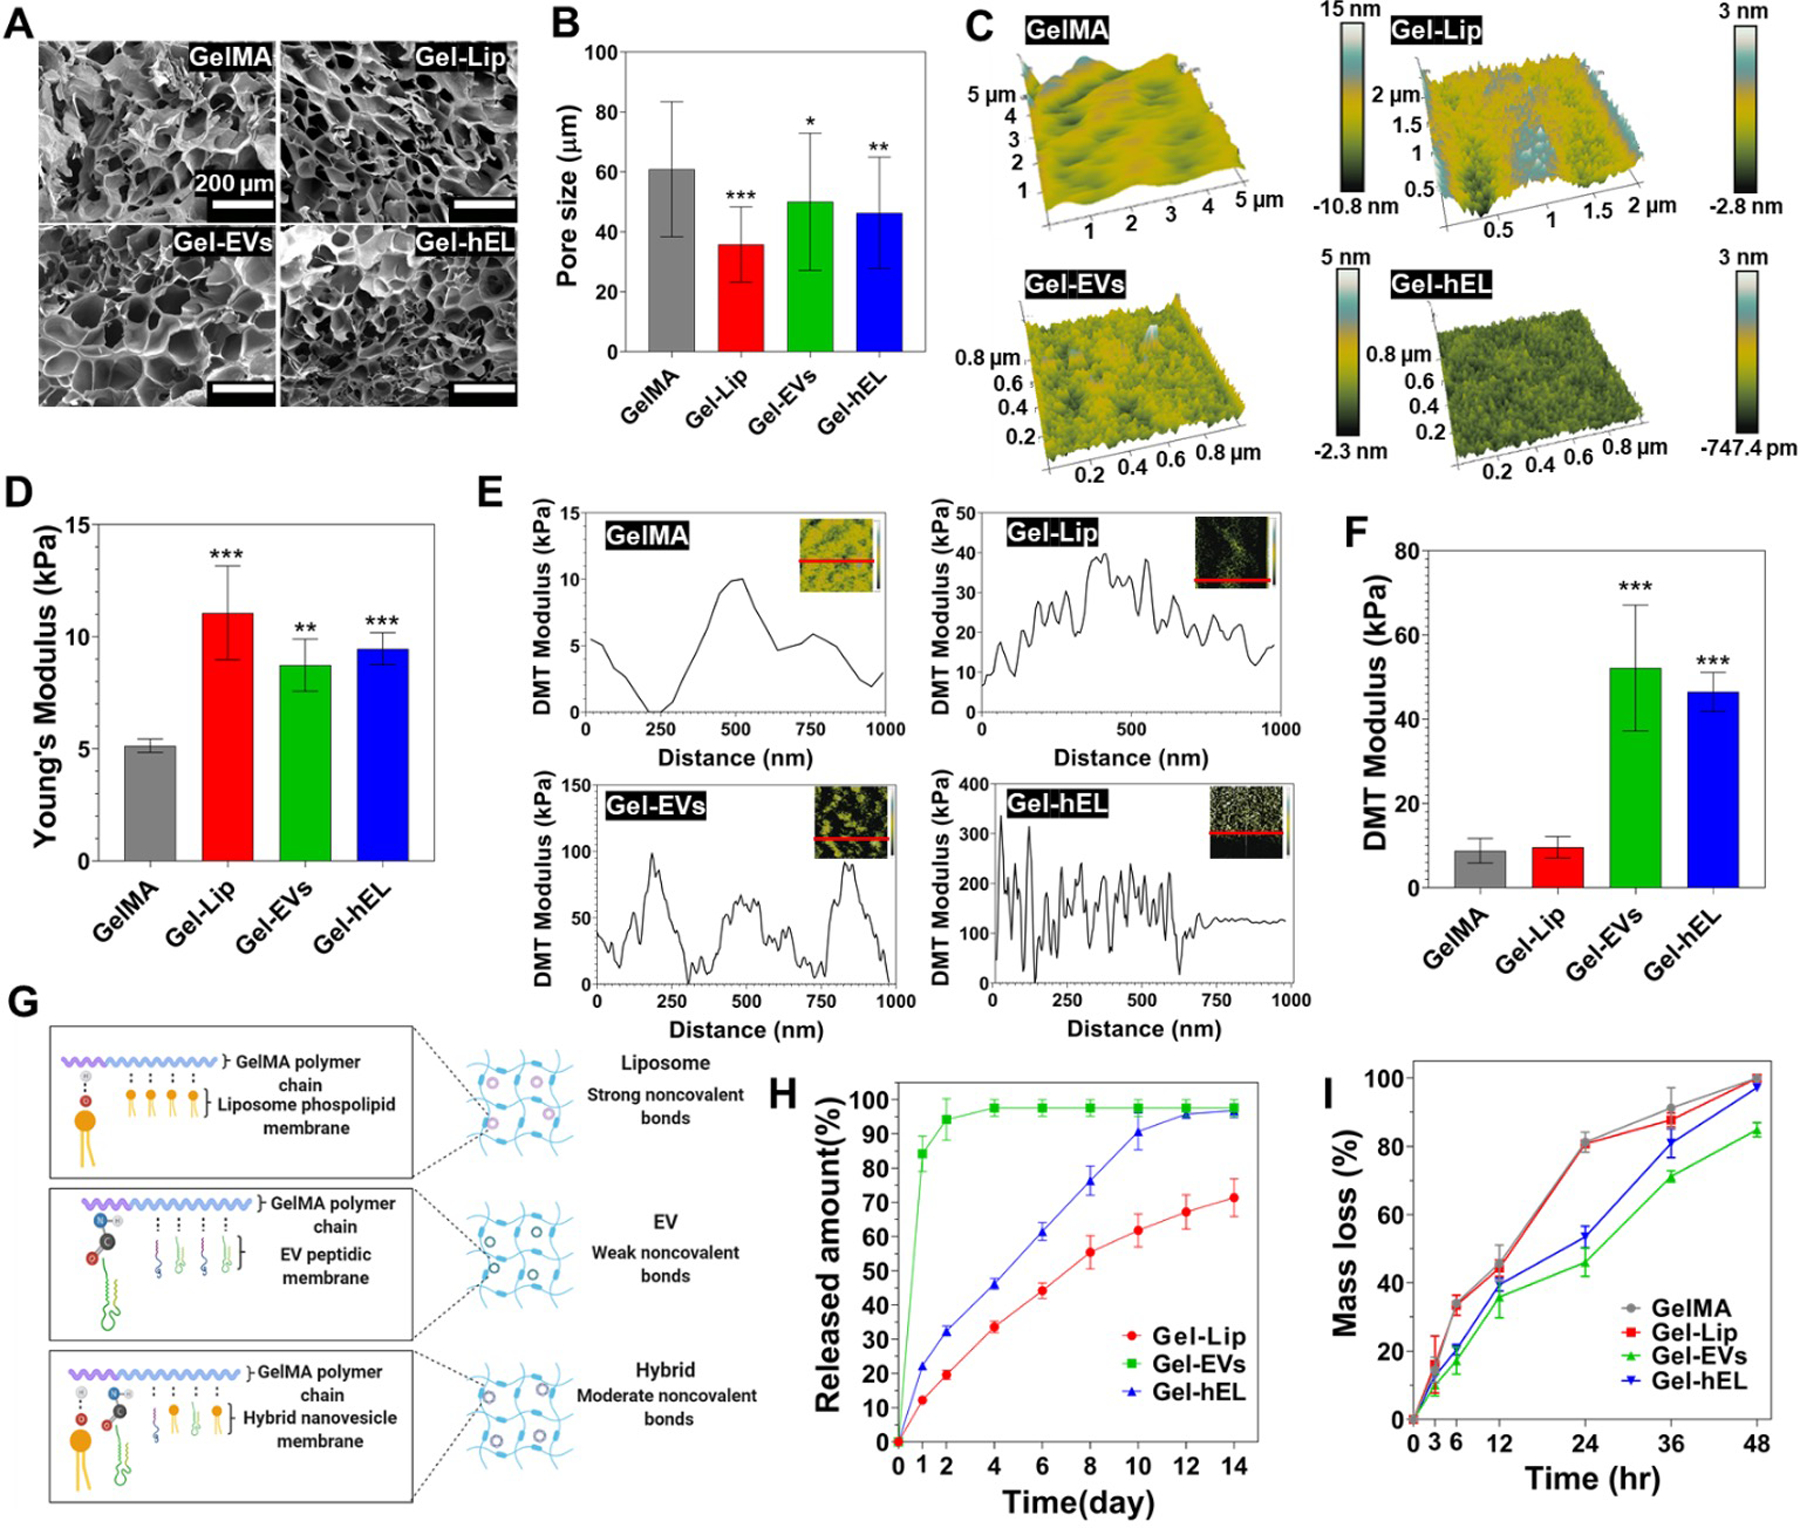
Figure 3.

Characterization of 7.5% (w/v) GelMA hydrogels embedding NVs (100 μg/mL) (Gel-NVs). (A) SEM cross-sectional images of Gel-NVs hydrogels. (B) Pore size measurements of Gel-NVs hydrogels (n=50). (C) Spatial topography of Gel-NVs measured by AFM. (D) Young’s modulus of Gel-NVs hydrogels (n=5). (E) DMT modulus distribution profile of Gel-NVs. (F) Average DMT modulus values of Gel-NVs. (G) Schematic representation of electrostatic interactions between GelMA matrix and NVs. Created with BioRender.com. (H) Release profile of NVs from GelMA hydrogels for 14 days (n=5). (I) Degradation profile of Gel-NVs hydrogels for 48 hours when exposed to collagenase type II. All data are expressed as mean ± standard deviation. Significance is indicated as *(p < 0.05), **(p < 0.01) and ***(p < 0.001).
