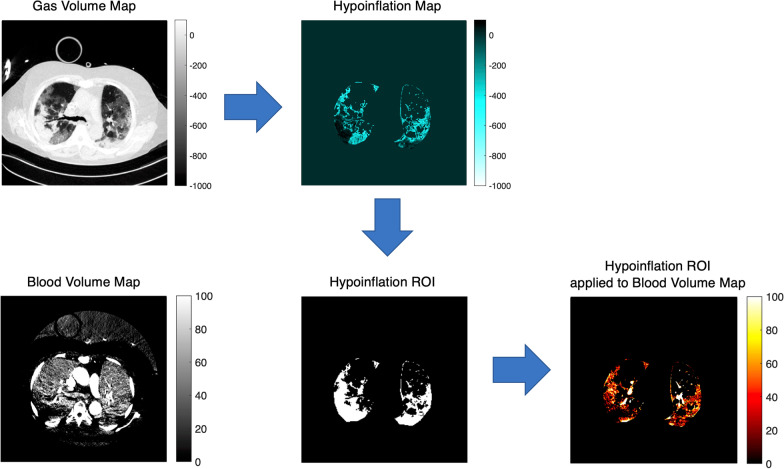
Fig. 2.
Dual-energy computed tomography image analysis. Pulmonary gas volume maps were characterized by a HU range of − 1000 to + 100 HU. Pulmonary blood volume maps were characterized by a HU range of − 100 to + 150 HU. To assess hypoxic pulmonary vasoconstriction, pulmonary blood volume distribution was assessed for the whole lung and for the hypoinflated lung, the latter characterized by poorly inflated and non-inflated lung regions (HU between − 500 and + 100). A region of interest for hypoinflated lung (Hypoinflation ROI) was obtained extrapolating hypoinflated areas (Hypoinflation Map) from the pulmonary gas volume map. Hence, the hypoinflated ROI was applied to pulmonary blood volume map to analyze blood volume distribution of the hypoinflated areas

