Figure 1.
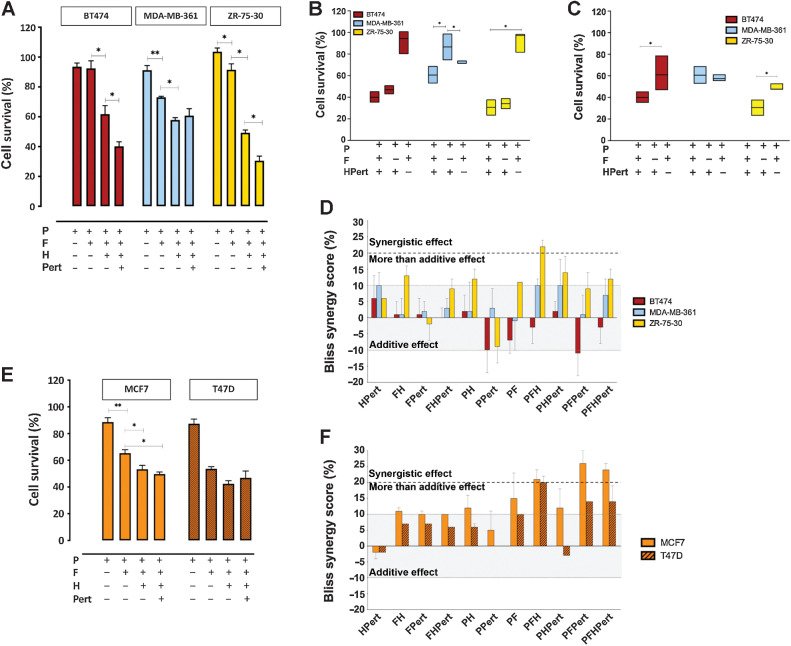
Drug combinations. A, Percent of cell survival by the MTT cytotoxicity assay after 72-hour exposure to palbociclib (0.1 µmol/L), fulvestrant (1 µmol/L), trastuzumab (20 µg/mL), and pertuzumab (25 µg/mL) and their combinations in BT474 (red bars), MDA-MB-361 (light blue bars), and ZR-75–30 (yellow bars). B, Contribute of fulvestrant or anti-HER2 therapy to the four drugs combination in the different HER2+ cell lines: the percentage of cell survival, measured by MTT, after 72 hours of P + F + HPert was directly compared with the treatment P + HPert (minus F) and P + F (minus HPert) for BT474, MDA-MB-361, and ZR-75–30. C, Contribute of Pertuzumab to the 4 drugs combination in the different HER2+ cell lines: the percentage of cell survival after 72 hours of PFH + Pert was directly compared with the treatment PFH (minus Pert). D, Percent Bliss synergy score calculated for each combination. Values from -10% up to 10% (grey area) correspond to additivity; the area from 10% to 20% (dashed bold line) corresponds to a more than additive effect; the area above the dashed bold line at 20% corresponds to synergism. E, Percent survival by MTT assay and F, Percent Bliss synergy score in HER2low MCF7 (orange bars) and T47D cells (brown bars). Data are mean values of three or more experiments ± SEM; P values by Kruskal–Wallis test (multiple comparison by Wilcoxon unpaired test) are reported only for the drugs combination relevant for synergism evaluation. *, P ≤ 0.05; **, P < 0.01.

