. 2022 Mar 7;28(10):2167–2179. doi: 10.1158/1078-0432.CCR-21-3185

Figure 6.

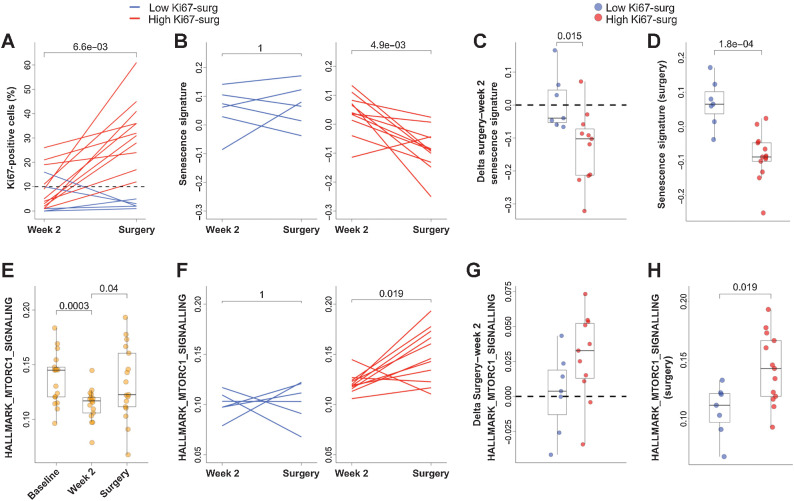
Figure 6. Proliferation markers and senescence at surgery in NA-PHER2 patients. A, Individual dynamic, from week 2 to time of surgery in residual disease, of Ki67-positive cells (%) detected by IHC in tumors biopsies of patients (n = 17) treated with palbociclib, fulvestrant, trastuzumab, and pertuzumab (PFHPert). Patients with low (<10%; blue line) or high Ki67-w2 (≥10%; red line) were reported. Note that levels of Ki67 were not associated with time interval between treatment discontinuation and surgery. Dashed line represents the 10% cut-off. P by Wilcoxon paired test (two tailed). B, The dynamic of Senescence Signature score between week2 and surgery was different in patients with low Ki67-surg (blue line, left panel) and in the patients with high Ki67-surg (red line, right panel). P value by Wilcoxon paired test (two-tailed). box plots show, respectively, that both the Delta Senescence Signature (surgery—week 2; C, n = 18) and the absolute score values (D, n = 20) of Senescence Signature were significantly different between patients with low Ki67-surg (blue circles) and with high Ki67-surg (red circles). P values were by Wilcoxon unpaired test (two-tailed). E, Dynamics of HALLMARK_MTORC1_SIGNALLING evaluated in 17 patients with paired samples at baseline, week 2, and surgery (n = 51). P values were by Wilcoxon unpaired test (two-tailed). F, Relationship between Ki67 and MTORC1 pathway during treatment with PFHPert. In the interval between week 2 and surgery, the levels of gene signature HALLMARK_MTORC1_SIGNALLING were maintained low in patients with low Ki67-surg (blue line; left panel) while were significantly upmodulated in patients with high Ki67-surg (red line; right panel). P value was by Wilcoxon paired test (two-tailed). G, Box plot showing that in patients with low Ki67-surg (blue circles) the delta from surgery to week 2 of HALLMARK_MTORC1_SIGNALLING signature is lower than that measured in patients with high Ki67-surg (red circles), but the difference was not statistically significant (P = 0.085). P values by Wilcoxon unpaired test (two-tailed). H, The absolute HALLMARK_MTORC1_SIGNALLING score detected at surgery was significantly correlated with Ki67-surg. Patients with low Ki67-surg (blue circles) had low levels of MTORC1 signal activation.

Proliferation markers and senescence at surgery in NA-PHER2 patients. A, Individual dynamic, from week 2 to time of surgery in residual disease, of Ki67-positive cells (%) detected by IHC in tumors biopsies of patients (n = 17) treated with palbociclib, fulvestrant, trastuzumab, and pertuzumab (PFHPert). Patients with low (<10%; blue line) or high Ki67-w2 (≥10%; red line) were reported. Note that levels of Ki67 were not associated with time interval between treatment discontinuation and surgery. Dashed line represents the 10% cut-off. P by Wilcoxon paired test (two tailed). B, The dynamic of Senescence Signature score between week2 and surgery was different in patients with low Ki67-surg (blue line, left panel) and in the patients with high Ki67-surg (red line, right panel). P value by Wilcoxon paired test (two-tailed). box plots show, respectively, that both the Delta Senescence Signature (surgery—week 2; C, n = 18) and the absolute score values (D, n = 20) of Senescence Signature were significantly different between patients with low Ki67-surg (blue circles) and with high Ki67-surg (red circles). P values were by Wilcoxon unpaired test (two-tailed). E, Dynamics of HALLMARK_MTORC1_SIGNALLING evaluated in 17 patients with paired samples at baseline, week 2, and surgery (n = 51). P values were by Wilcoxon unpaired test (two-tailed). F, Relationship between Ki67 and MTORC1 pathway during treatment with PFHPert. In the interval between week 2 and surgery, the levels of gene signature HALLMARK_MTORC1_SIGNALLING were maintained low in patients with low Ki67-surg (blue line; left panel) while were significantly upmodulated in patients with high Ki67-surg (red line; right panel). P value was by Wilcoxon paired test (two-tailed). G, Box plot showing that in patients with low Ki67-surg (blue circles) the delta from surgery to week 2 of HALLMARK_MTORC1_SIGNALLING signature is lower than that measured in patients with high Ki67-surg (red circles), but the difference was not statistically significant (P = 0.085). P values by Wilcoxon unpaired test (two-tailed). H, The absolute HALLMARK_MTORC1_SIGNALLING score detected at surgery was significantly correlated with Ki67-surg. Patients with low Ki67-surg (blue circles) had low levels of MTORC1 signal activation.