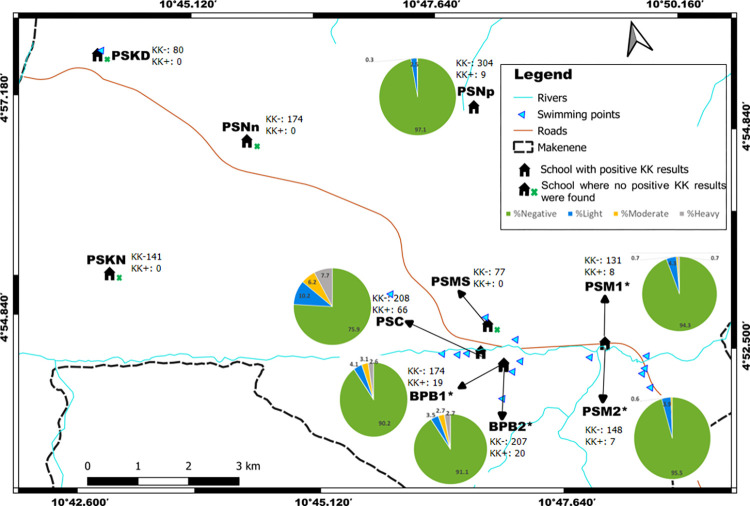
Fig 2.
Distribution per school of the percentage of children with no infection or carrying different infection intensities inferred from Kato-Katz (base layer of the maps were obtained using a free online spatial data software (https://www.diva-gis.org/gdata). BPB1: Government bilingual primary school of Baloua group 1; BPB2: Government bilingual primary school of Baloua group 2; PSM1: Public school of Makenene group 1; PSM2: Public school of Makenene group 2; PSNn: Public school of Nyokon; PSKD: Public school of Kinding Nde; PSKN: Public school of Kinding Ndjabi; PSMS: Public school of Mock-Sud; PSC: Public school of Carrière; PSNp: Public school of Ngokop, *: Schools in the same building. KK+: Number of children carrying S. mansoni eggs in each school; KK-: Number of children without S. mansoni egg in each school.

