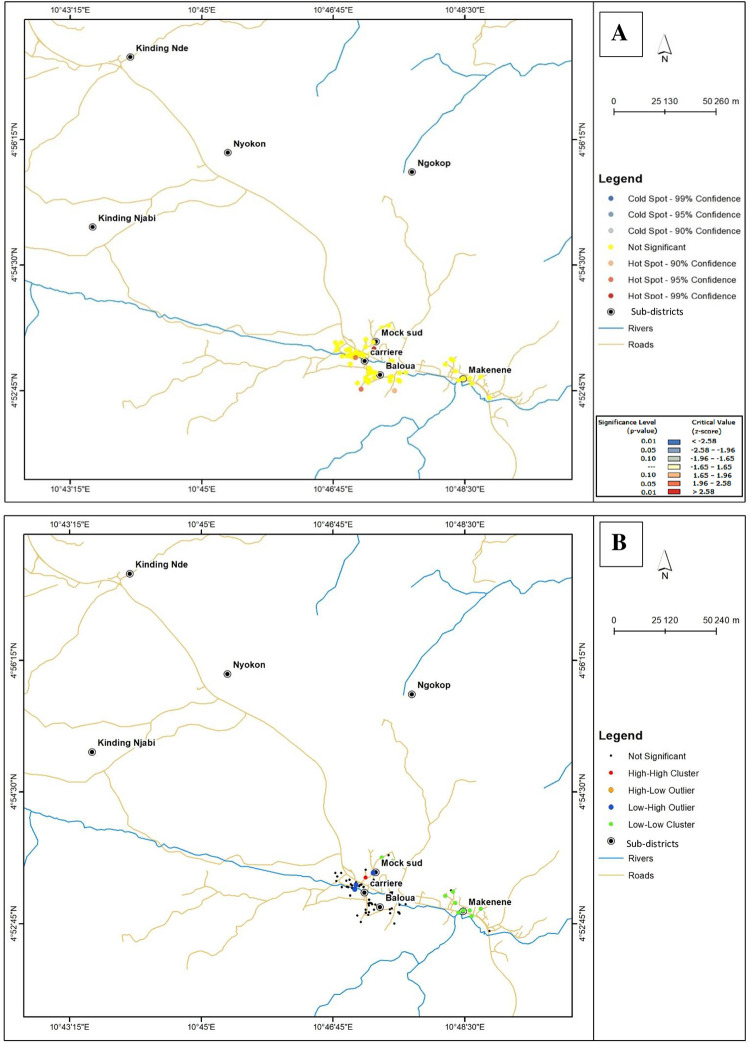
Fig 7.
Global and Local Moran’s I cluster maps showing S. mansoni infection intensities inferred from KK (base layer of the maps were obtained using a free online spatial data software (https://www.diva-gis.org/gdata). High-high cluster indicates significant (p < 0.05) clustering (hot-spot) of houses of children carrying heavy infection intensities of S. mansoni; low-low cluster indicates significant (p < 0.05) clustering (cold spot) of houses of children carrying light infection intensities of S. mansoni; low-high outlier indicates areas where houses of children carrying heavy infection intensities were surrounded by those of children carrying light or moderate infection intensities; high-low outlier indicates areas where houses of children carrying light infection intensities were surrounded by those of children carrying heavy infection intensity.

