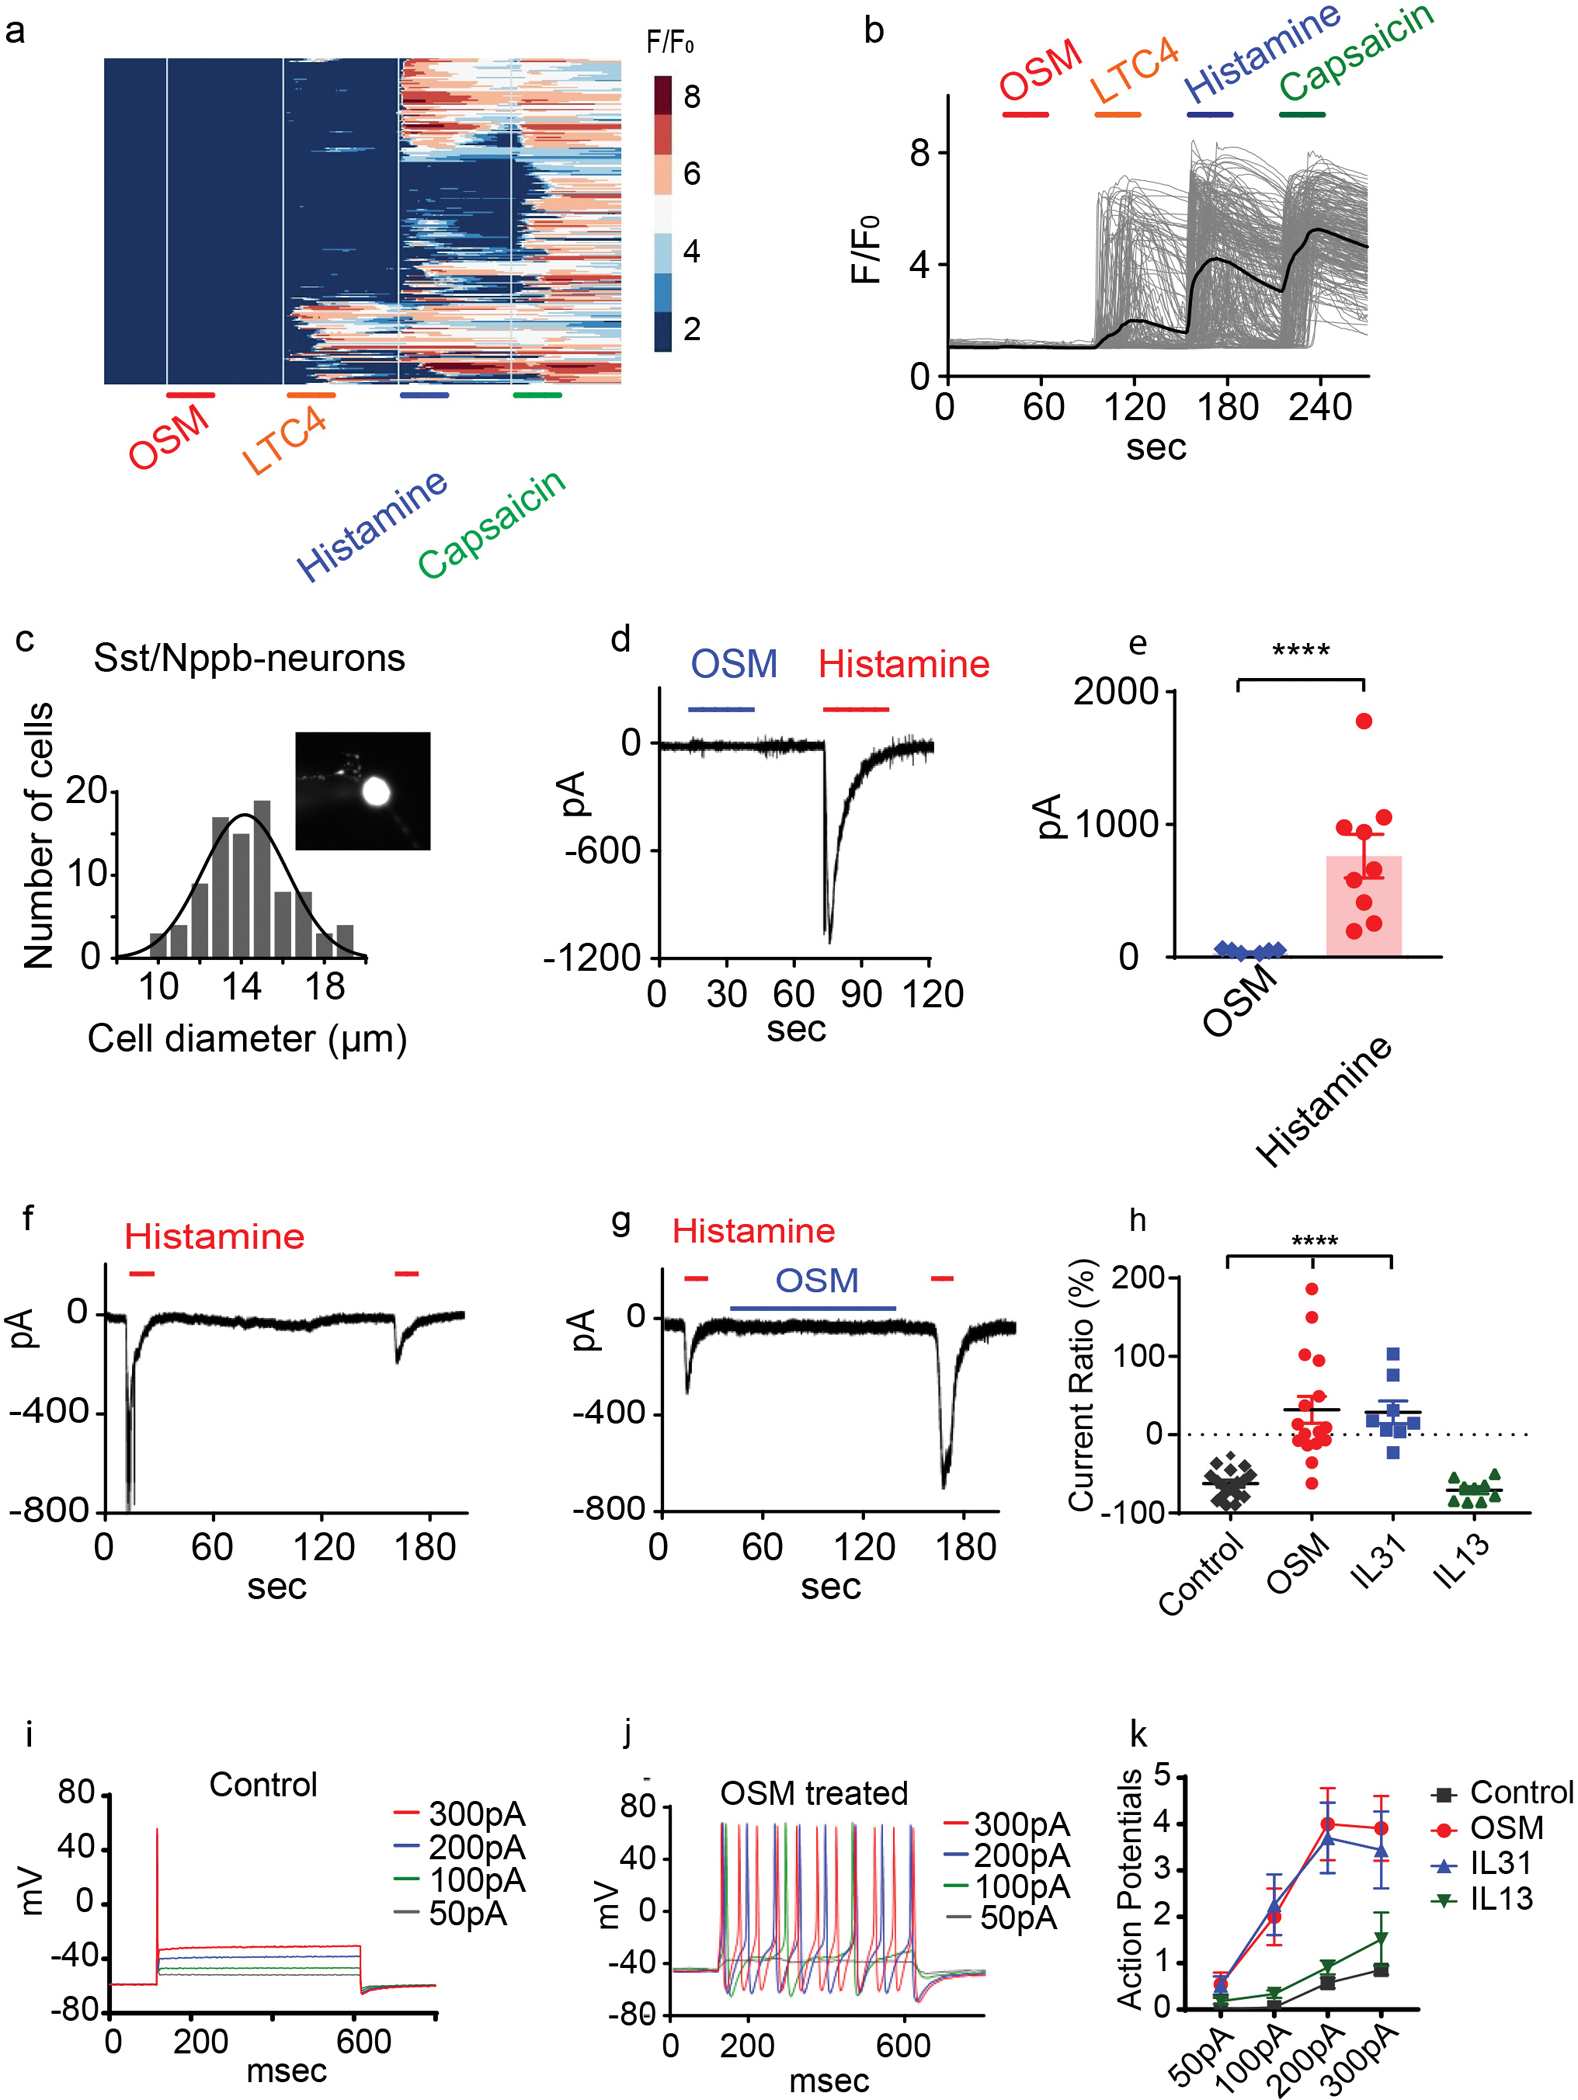
Figure 3. Oncostatin M sensitizes Nppb-neurons.

(A-B) Calcium imaging of dissociated Trpv1-GCaMP6 DRG neurons challenged (30 second; indicated with bars) with OSM (1μg/mL), LTC4 (100nM), histamine (10μM), and capsaicin (10μM) (326 neurons n= 3 mice). The colored scale bar represents normalized changes of fluorescence signals. The solid line in B indicates the averaged response of all the capsaicin-responsive neurons. (C) Quantification of cell diameter of Nppb-neurons (insert panel) (n=90). (D-E) Whole-cell voltage-clamp recordings (held at −60mV) of dissociated Nppb-tdTomato neurons exposed to OSM alone (blue line, 1μg/mL), and histamine (red line, 100μM). (E) n=9 neurons from 2 mice, ****p<0.0001, two-tailed Student’s T-test. (F-G). (F-H) Electrophysiological traces of Nppb-neuron responses. (F) Responses to histamine challenge without OSM pretreatment and (G) after pretreatment with OSM (1μg/mL) for 2 minutes. (H) Summary of the cytokine-mediated effects on histamine-evoked currents. Repetitive histamine (n=17), pretreatment with OSM (n=16) or IL-31 (n=8) (for OSM****p<0.0001 and for IL-31 p<0.0001), one-way ANOVA with Dunnett’s post-hoc test. Pretreatment with IL-13 (n=9) (p=0.95). (I-K) Electrophysiological traces of Nppb-neurons under current clamp conditions. (I) Control conditions, and (J) after incubation with OSM (100ng/mL) for 2–3 days. (K) Quantification of effects of cytokine. Prolonged incubation with OSM (n=22) or IL-31 (n=27), IL-13 (n=33), and controls (n=21); ***p=0.0003, ***p=0.0003, and p=0.7950 respectively, two-way ANOVA with Dunnett’s post-hoc test. Data presented as mean ± SEM.
