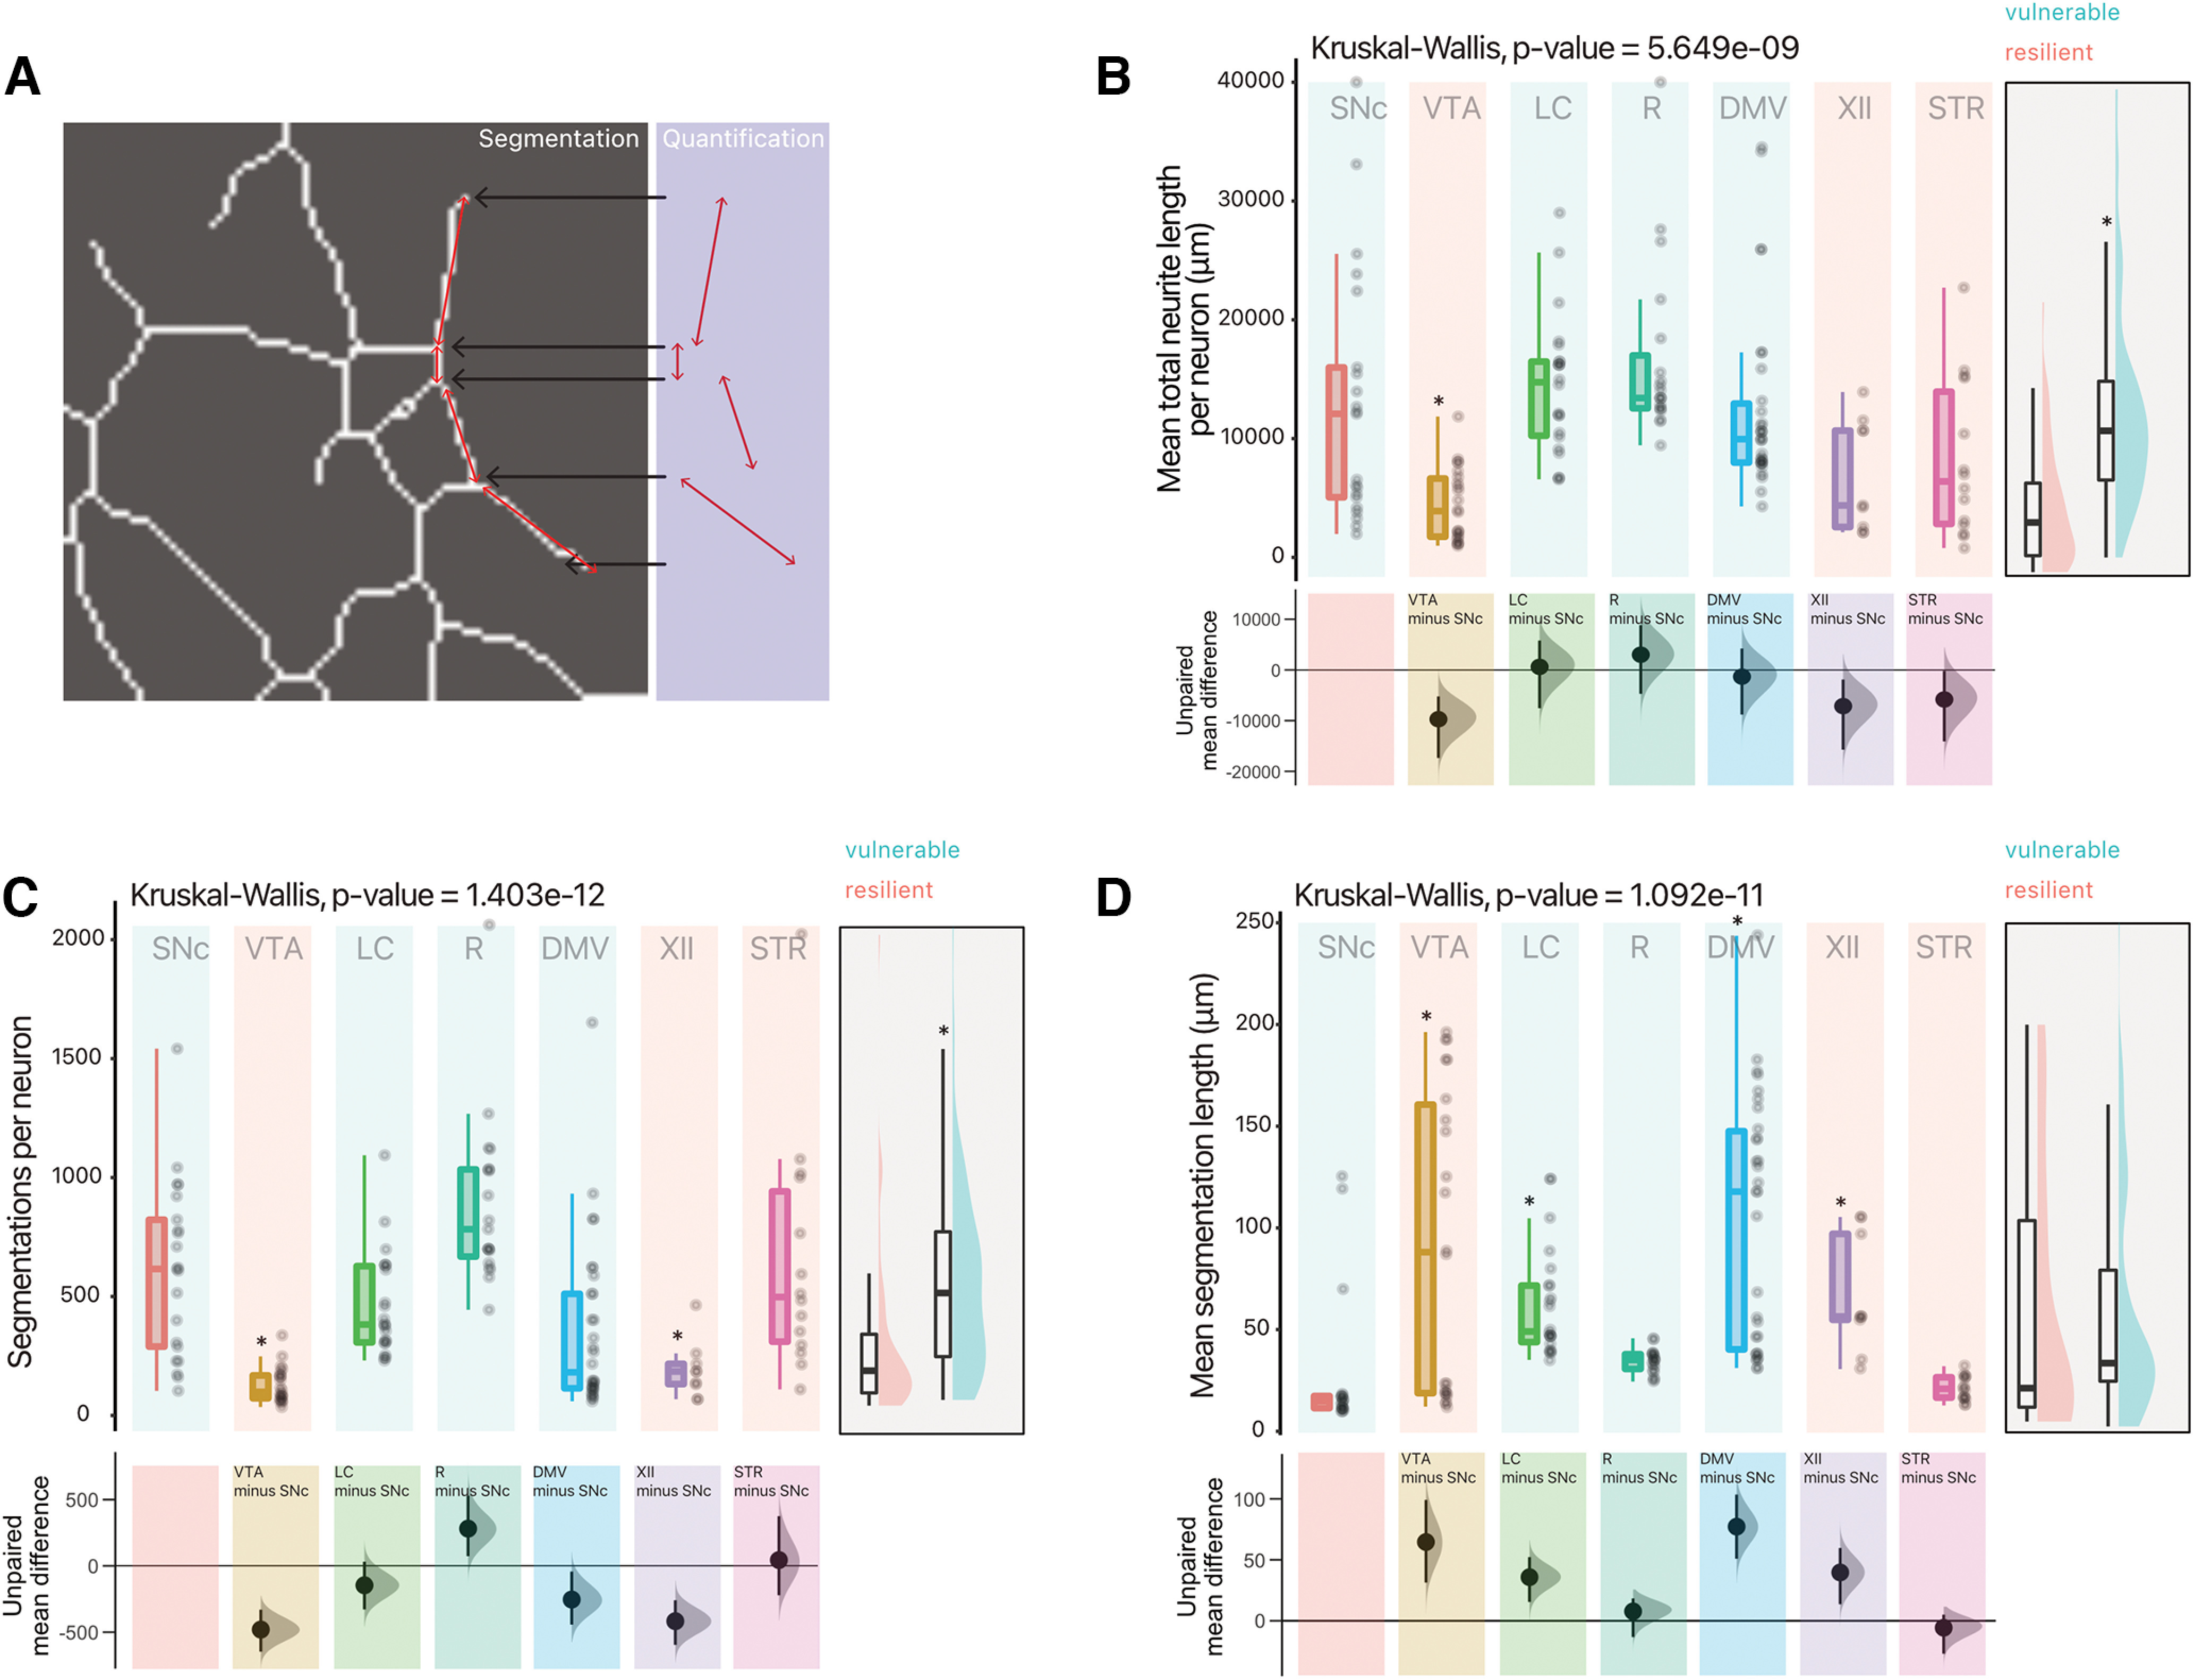
Figure 6.

Vulnerable neurons have large axonal domains, which are globally more complex than resilient neurons. A, Overview of quantification method for neurite segmentations. B, Quantification of mean neurite length (total neurite length, per well, divided by number of neurons). Box and whiskers plots, in the style of Tukey, where the median value is indicated, and the lower and upper hinges correspond to the first and third quartiles, Kruskal–Wallis multiple comparison, p-values adjusted with the Bonferroni method, *p < 0.05. Shared control estimation plot: mean difference for comparisons against the shared control, SNc, using Data Analysis with Bootstrap Estimation, with 5000 bootstrap resamples. All confidence intervals are bias-corrected and accelerated. C, Quantification of mean number of segmentations (sections) of neurites segmented per neuron. Box and whiskers plots, in the style of Tukey, where the median value is indicated, and the lower and upper hinges correspond to the first and third quartiles, Kruskal–Wallis multiple comparison, p-values adjusted with the Bonferroni method, *p < 0.05. Shared control estimation plot: mean difference for comparisons against the shared control, SNc, using Data Analysis with Bootstrap Estimation, with 5000 bootstrap resamples. All confidence intervals are bias-corrected and accelerated. D, Quantification of mean length of segmentations (sections) of neurites segmented per neuron. Box and whiskers plots, in the style of Tukey, where the median value is indicated, and the lower and upper hinges correspond to the first and third quartiles, Kruskal–Wallis multiple comparison, p-values adjusted with the Bonferroni method, *p < 0.05. Shared control estimation plot: mean difference for comparisons against the shared control, SNc, using Data Analysis with Bootstrap Estimation, with 5000 bootstrap resamples. All confidence intervals are bias-corrected and accelerated. B to C have a supplementary plot of all data grouped as Vulnerable and Resilient, where an independent two-group Mann–Whitney U test was performed, and an asterisk denotes p < 0.05. Precise values can be found in the supplementary tables alongside unpaired Gardner–Altman two group estimation plots. Detailed statistical tests and multiple comparisons can be found in Extended Data Table 6-1. LC, locus ceoruleus; DMV, dorsal motor nucleus of the vagus; XII, hypoglossal nucleus; SNc, substantia nigra pars compacta; VTA, ventral tegmental area; R, raphé; STR, striatum.
