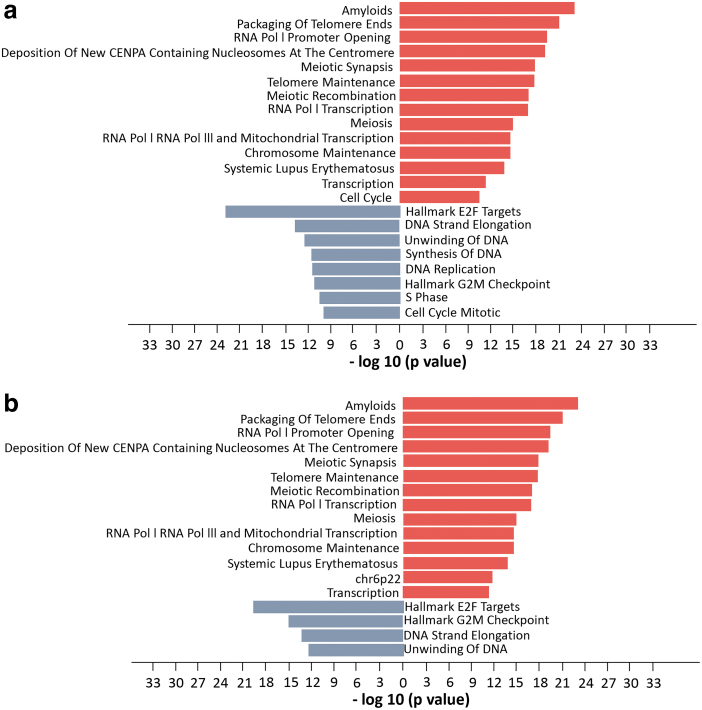
FIG. 4.
Pathway enrichment analysis of (a) combined proteomic analysis following EGFR ASO 16, 18, and 21 treatment compared with standard ASO control (STD) in PC9 cells. Comparable pathway enrichment was observed following (b) direct inhibition of EGFR using erlotinib treated relative to STD. Analysis was performed using the DE proteins. Figures represent pathways that enriched for increased (red) and decreased (blue) protein expression. All pathways have negative log10 P values >10. DE, differentially expressed.

