. 2022 Oct 25;11:e80150. doi: 10.7554/eLife.80150

Figure 7. The immune landscape in the high and low artificial intelligence-derived prognostic signature (AIDPS) groups.

(A) The heatmap of 28 immune cell types in the high and low AIDPS groups. (B) Boxplot of relative infiltrate abundance of 28 immune cell types in patients with high and low AIDPS groups. (C) Boxplot of relative expression levels at 27 immune checkpoints profiles between the high and low AIDPS patients. *p<0.05, **p<0.01, ***p<0.001.

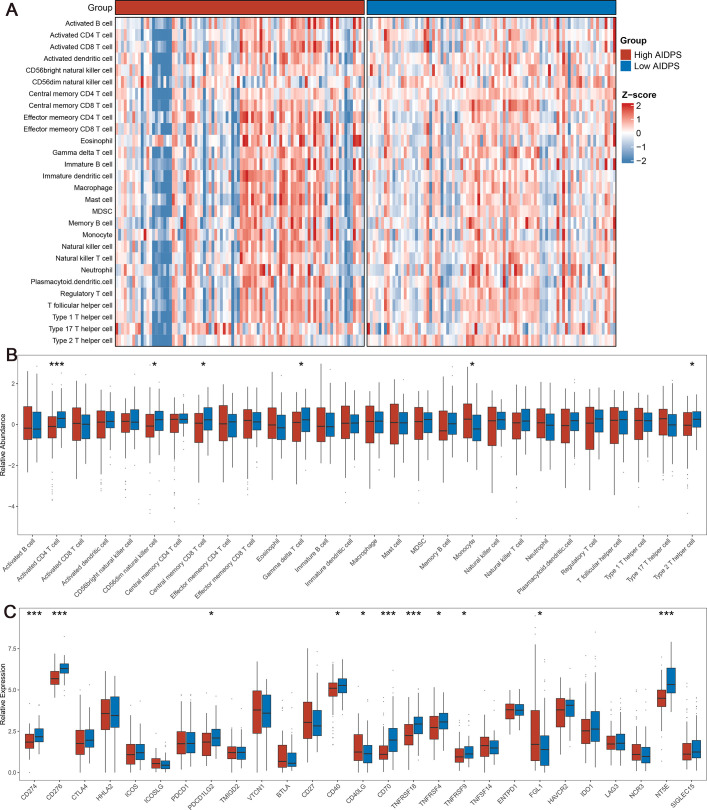
Figure 7.

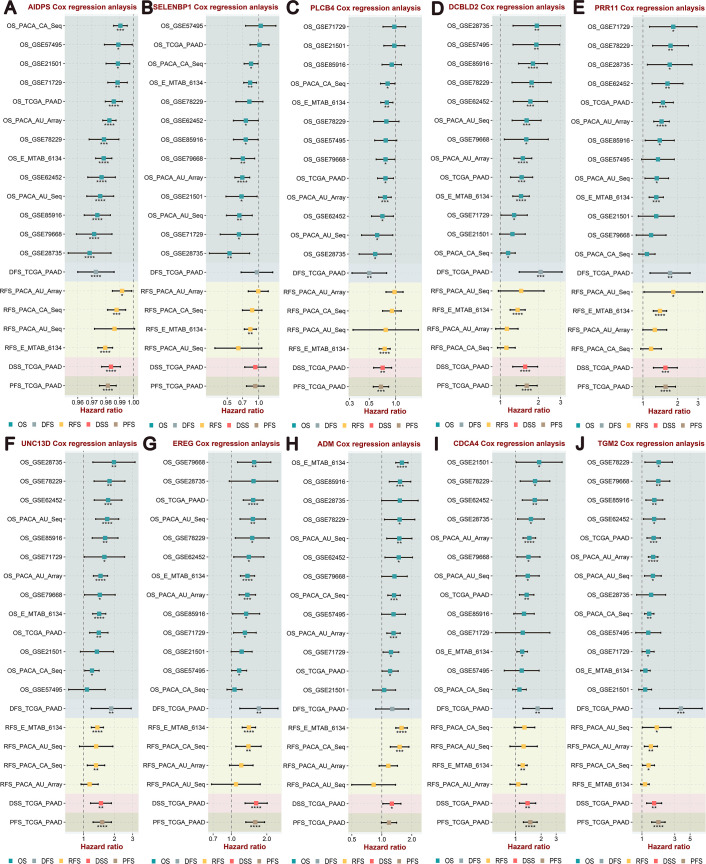
Figure 7—figure supplement 1. Integrated Cox regression analysis of survival variables for artificial intelligence-derived prognostic signature (AIDPS) and nine AIDPS genes in 13 cohorts.

Figure 7—figure supplement 1.

(A–J) Univariate Cox regression analysis of overall survival (OS), disease-free survival (DFS), relapse-free survival (RFS), disease-specific survival (DSS), and progression-free survival (PFS) for AIDPS (A), SELENBP1 (B), PLCB4 (C), DCBLD2 (D), PRR11 (E), UNC13D (F), EREG (G), ADM (H), CDCA4 (I), and TGM2 (J) in the training cohort, nine testing cohorts, and three external validation cohorts. .
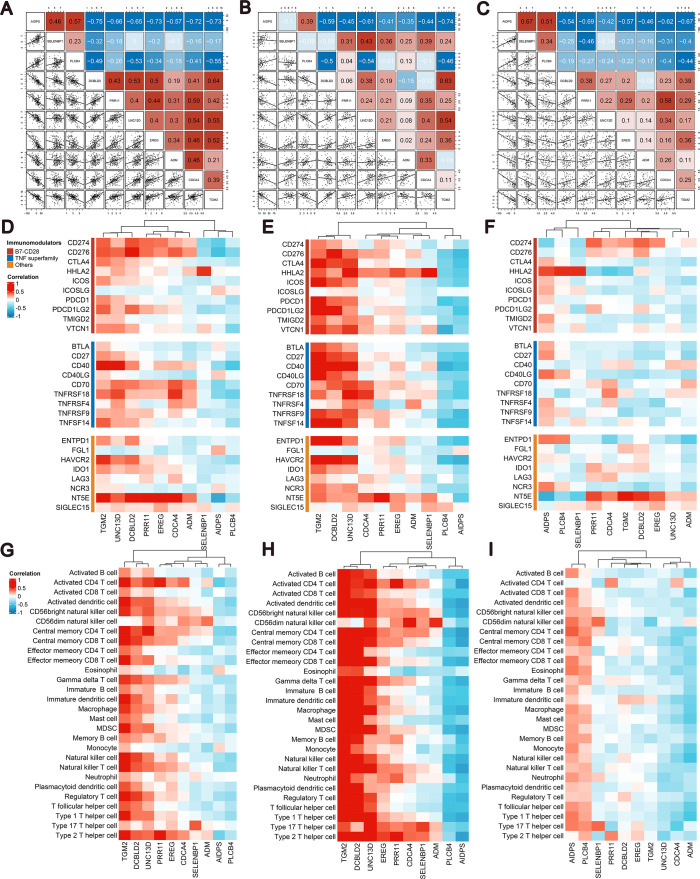
Figure 7—figure supplement 2. The correlation of artificial intelligence-derived prognostic signature (AIDPS) and its nine genes with immune molecules and immune cell types.

Figure 7—figure supplement 2.

(A–C) The correlation between AIDPS and its nine genes at expression level in the whole (A), high AIDPS (B) and low AIDPS (C) TCGA-PAAD cohort. (D–F) The correlation of AIDPS and its nine genes with 27 immune checkpoint molecules in the whole (D), high AIDPS (E), and low AIDPS (F) TCGA-PAAD cohort. (G–I) The correlation of AIDPS and its nine genes with 28 immune cell types in the whole (G), high AIDPS (H), and low AIDPS (I) TCGA-PAAD cohort.
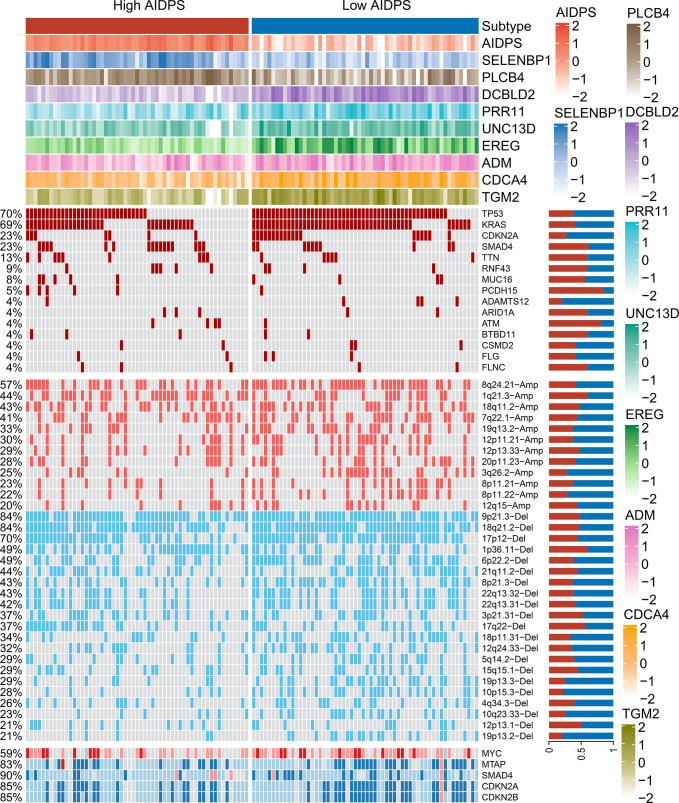
Figure 7—figure supplement 3. The relevance of artificial intelligence-derived prognostic signature (AIDPS) and its nine genes with mutation and copy number alteration.

Figure 7—figure supplement 3.

From top to bottom panels, the AIDPS and expression of nine AIDPS genes SELENBP1, PLCB4, DCBLD2, PRR11, UNC13D, EREG, ADM, CDCA4, and TGM2 for each sample; top 15 mutated genes and broad-level copy number alterations (>20%), and selected genes located within chromosomes 8q24.21, 9p21.3, and 18q21.2 are shown in the high and low AIDPS TCGA-PAAD cohort. The proportion of the high and low AIDPS groups in each alteration is presented in the right bar charts.