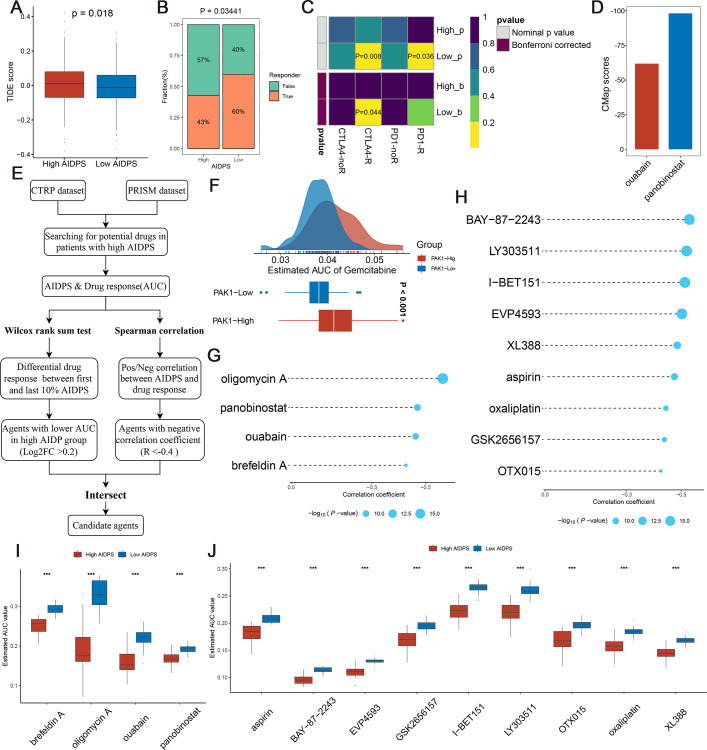
Figure 8. Evaluating therapeutic drug benefits.
(A) Boxplot of Tumour Immune Dysfunction and Exclusion (TIDE) score between the high and low artificial intelligence-derived prognostic signature (AIDPS) groups. (B) Percentage of immunotherapy responses at high and low AIDPS groups. (C) Submap analysis of the two groups and 47 pretreated patients with comprehensive immunotherapy annotations. For Submap analysis, a smaller p-value implied a more similarity of paired expression profiles. (D) Barplot of ouabain and panobinostat CMap scores in patients with high AIDPS. (E) Schematic outlining the strategy to develop potential therapeutic agents with higher drug sensitivity in the high AIDPS group. (F) Comparison of estimated gemcitabine’s sensitivity between high and low PAK1 expression groups. (G, H) The results of Spearman’s correlation analysis of Cancer Therapeutics Response Portal (CTRP)-derived compounds (G) and profiling relative inhibition simultaneously in mixtures (PRISM)-derived compounds (H). (I, J) The results of differential drug response analysis of CTRP-derived compounds (I) and PRISM-derived compounds (J), the lower values on the y-axis of boxplots imply greater drug sensitivity. CMap, Connectivity Map *p<0.05, **p<0.01, ***p<0.001.

