
Figure 8.
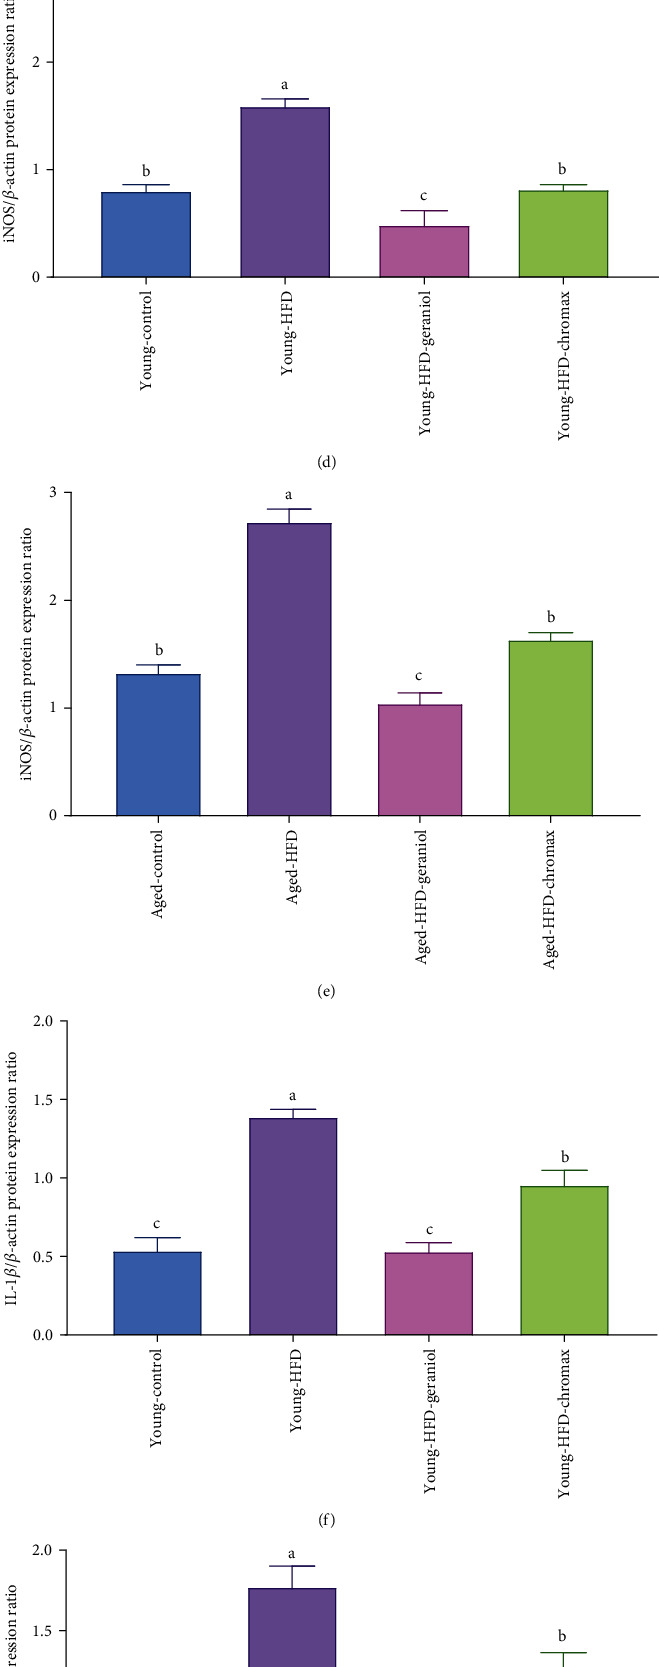
Neuroinflammatory protein expression profile: (a) iNOS/β-actin, COX-2/β-actin, IL-1β/β-actin, and p65NF-κB/β-actin immunoblot; (b) quantitative analysis of COX-2/β-actin in the brain of young rats; (c) COX-2/β-actin in the brain of aged rats; (d) iNOS/β-actin in the brain of young rats; (e) iNOS/β-actin in the brain of aged rats, (f) IL-1β/β-actin in the brain of young rats, (g) IL-1β/β-actin in the brain of aged rats, (h) p65NF-κB/β-actin in the brain of young rats, and (i) p65NF-κB/β-actin in the brain of aged rats. Data are expressed as the mean ± SEM (n = 3). Means of the same measured parameter with different letters in each bar (A–D) are significantly different (p < 0.01); the largest data value takes the letter (A), and the smallest data value takes the letter (D).