Fig. 3.

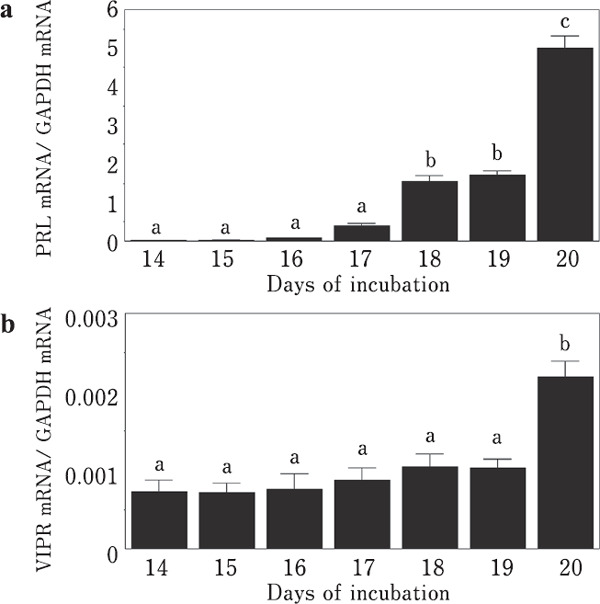
Changes in PRL and VIPR mRNA levels during embryogenesis. (a) PRL. (b) VIP receptor. Means with different letters are significantly different from each other (p<0.05). The values are represented as the means±SEM (n=4).

Changes in PRL and VIPR mRNA levels during embryogenesis. (a) PRL. (b) VIP receptor. Means with different letters are significantly different from each other (p<0.05). The values are represented as the means±SEM (n=4).