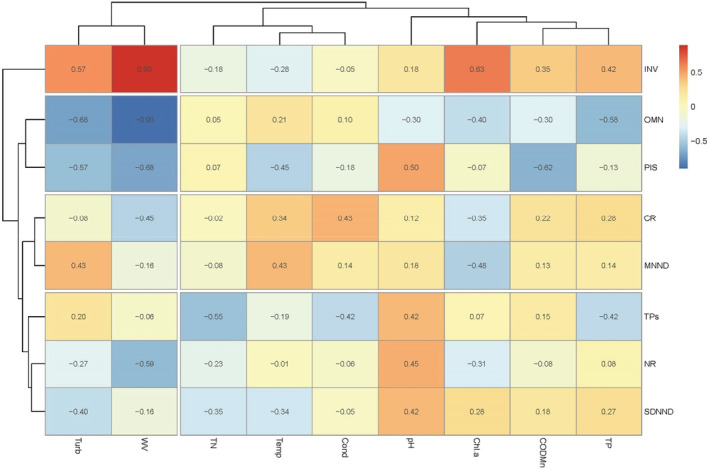
FIGURE 7.

Heatmap of the correlations between the environmental variables and the trophic metrics. Similarities between trophic metrics are shown in the left clustering, while similarities between environmental variables are shown in the top clustering. Hierarchical clustering of samples was performed with Spearman correlation analysis and the average linkage algorithm.
