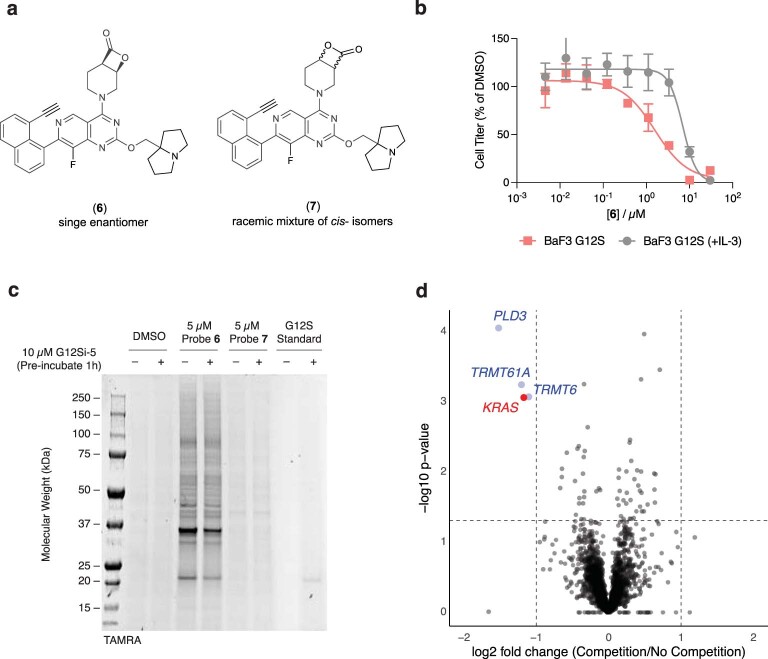
Extended Data Fig. 6. Analysis of the cellular targets of G12Si-5 using an alkyne analog.
a) Structures of probes 6 (an analog of G12Si-5) and 7 (regioisomer of 6). b) Relative growth of Ba/F3:K-Ras(G12S) cells in the presence (10 ng/mL) or absence of IL-3 after treatment with 6 for 72 h. Data is presented as mean values ± standard deviations (n = 3). c) In-gel fluorescence image of SDS-PAGE-resolved lysates of compound-treated A549 cells after click-conjugation of the tetramethylrhodamine (TAMRA) fluorophore. Data is representative of three independent experiments. d) Volcano plot of proteins captured by neutravidin from A549 cells treated with 6 (5 µM) after click conjugation of biotin. These cells were pre-treated with G12Si-5 (10 µM, “Competition”) or DMSO (“No Competition”) for 1 h prior to the addition of probe 6. Proteins were quantified using tandem mass tags. Fold change is calculated as ratio of mean intensities (three biological replicates per condition). p-values are calculated using unpaired, two-tailed Student’s t-test. See Methods section for mass spectrometry methods and Supplementary Dataset 1 for a full list of identified proteins.

