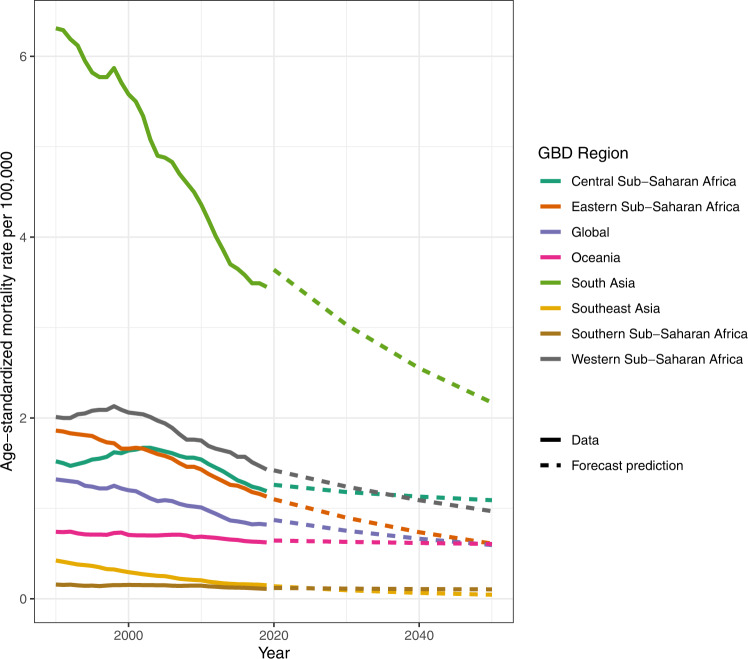
Fig. 4. Global and regional age-standardized snakebite envenoming mortality rate from 1990 to 2019 with forecasting to 2050 of the seven regions with the highest snakebite envenoming burden.
Age-standardized snakebite envenoming mortality rate per 100,000 by region and year, forecasted to 2050. The plot shows the top seven regions in terms of age-standardized rates in 2019, all of which had age-standardized mortality rates greater than 0.1 per 100,000. Lines in bold are the snakebite envenoming estimates from the primary statistical analysis pipeline, while dotted lines are the predictions from the forecast regression. No steps were made to align GBD 2019 cause-specific mortality rate estimates with the predicted forecast from 2020, and predictions are made based on the average annualized rate of change from 1990 to 2019 and the age-sex demographic composition of each region. Source data are provided as a Source Data file.

